
Wasmtime fixes two critical Cranelift flaws that could let attacker-controlled WebAssembly modules escape sandboxes, including an ARM64-only bug.
Get the latest international news and world events from around the world.

Microsoft 365 Token-Replay Attacks Compromise 97 Accounts at 79 Organizations
Attackers replayed stolen Microsoft 365 tokens to compromise 97 accounts at 79 organizations and registered 48 rogue Entra devices.
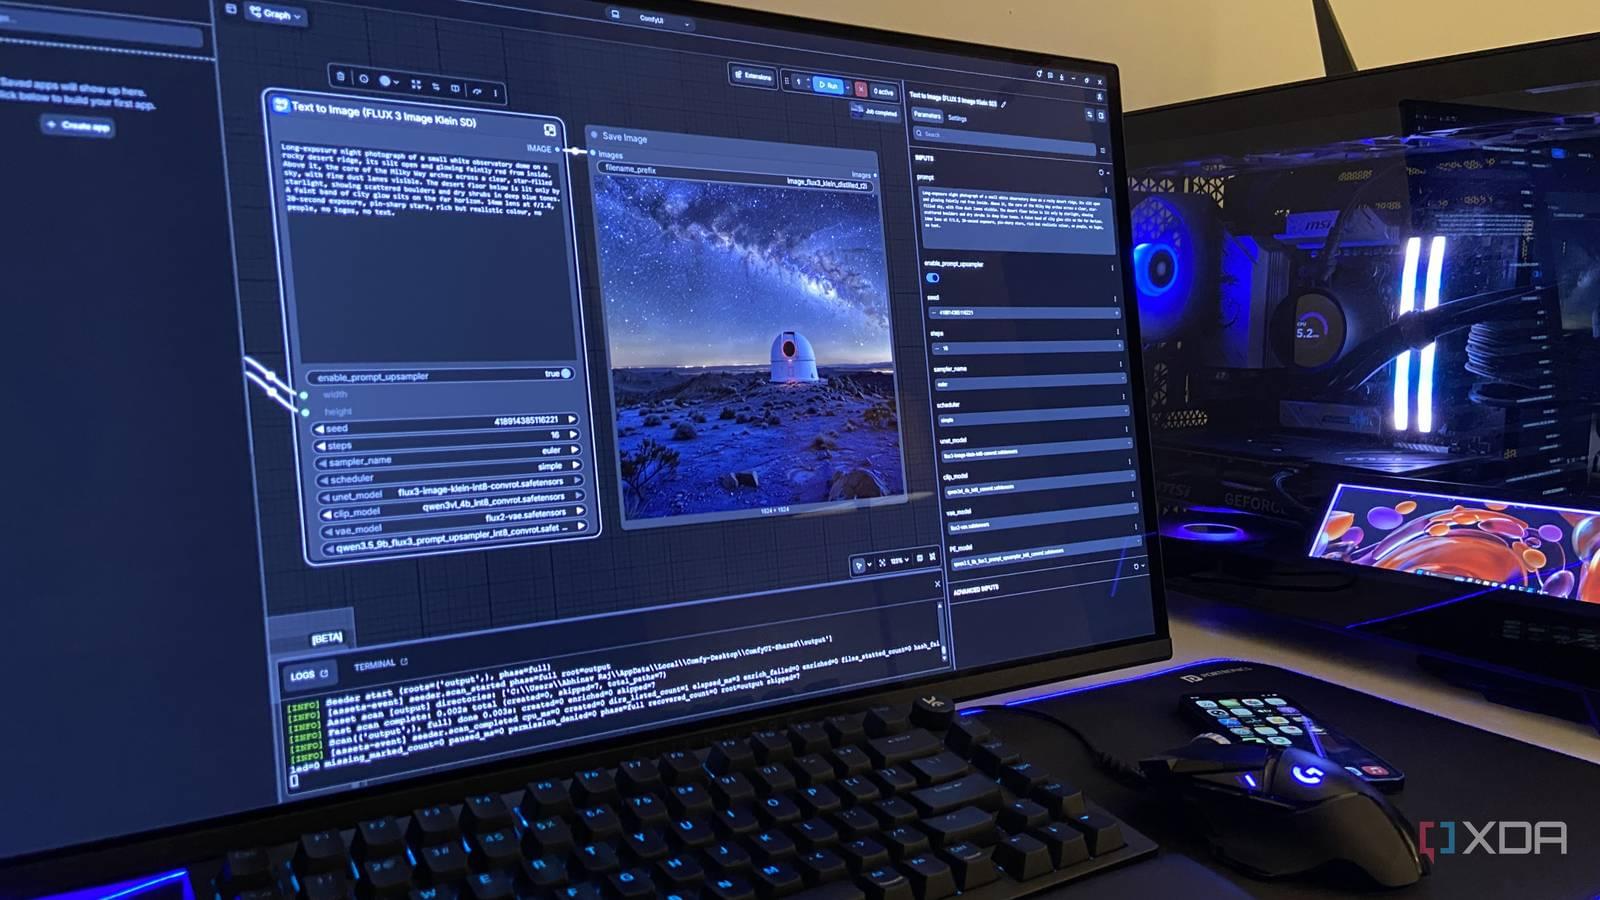
My self-hosted AI models research, code, and generate images, and all they cost is a GPU I already own
The only $20 I’m paying to is my savings account

Supercurrent enables the reading of quantum information without destroying it
One of the fundamental challenges of quantum computing is obtaining information from a quantum bit, or qubit. Unlike a conventional bit, which can be read repeatedly without altering its content, direct measurement of a quantum system typically causes the state to collapse before it can be determined. In other words, reading the information modifies it.
A new study proposes circumventing this problem by using a unique property of a certain type of qubit called an “Andreev qubit.” This qubit produces an oscillating electric supercurrent through its own quantum dynamics. This supercurrent would serve as a macroscopic indicator of the qubit’s state, enabling its reconstruction in a virtually nondestructive manner.
The study was published in the journal Physical Review B and was led by José Carlos Egues, a full professor at the São Carlos Institute of Physics at the University of São Paulo (IFSC-USP) in Brazil, and Yugui Yao of the School of Physics at the Beijing Institute of Technology in China. According to the authors, this method could eliminate the need for ancillas, auxiliary qubits used in current techniques for nondestructive quantum readout.
Subaquatic robot leverages biomimetics for natural movement
A few years ago, the same team designed an aquatic robot inspired by a manta ray. It could swim impressively fast, but it had one major drawback: a lack of three-dimensional maneuverability. Moving forward is one thing, but moving up and down, changing direction, and rotating in place is a whole different challenge. Many underwater robots have that same limitation, so the researchers decided to tackle this problem.
For their latest invention, they took inspiration from the feather star. These marine creatures have multiple flexible, feather-like limbs that help them move in different directions. Watching them, their movements seem almost effortless, but reproducing those maneuvers in robots is very difficult. It would typically require complex control systems and additional actuators – robotic components that produce movement.
But the new robot can maneuver in three dimensions using a few elastic limbs and just two actuators. And that’s exactly what makes it innovative.
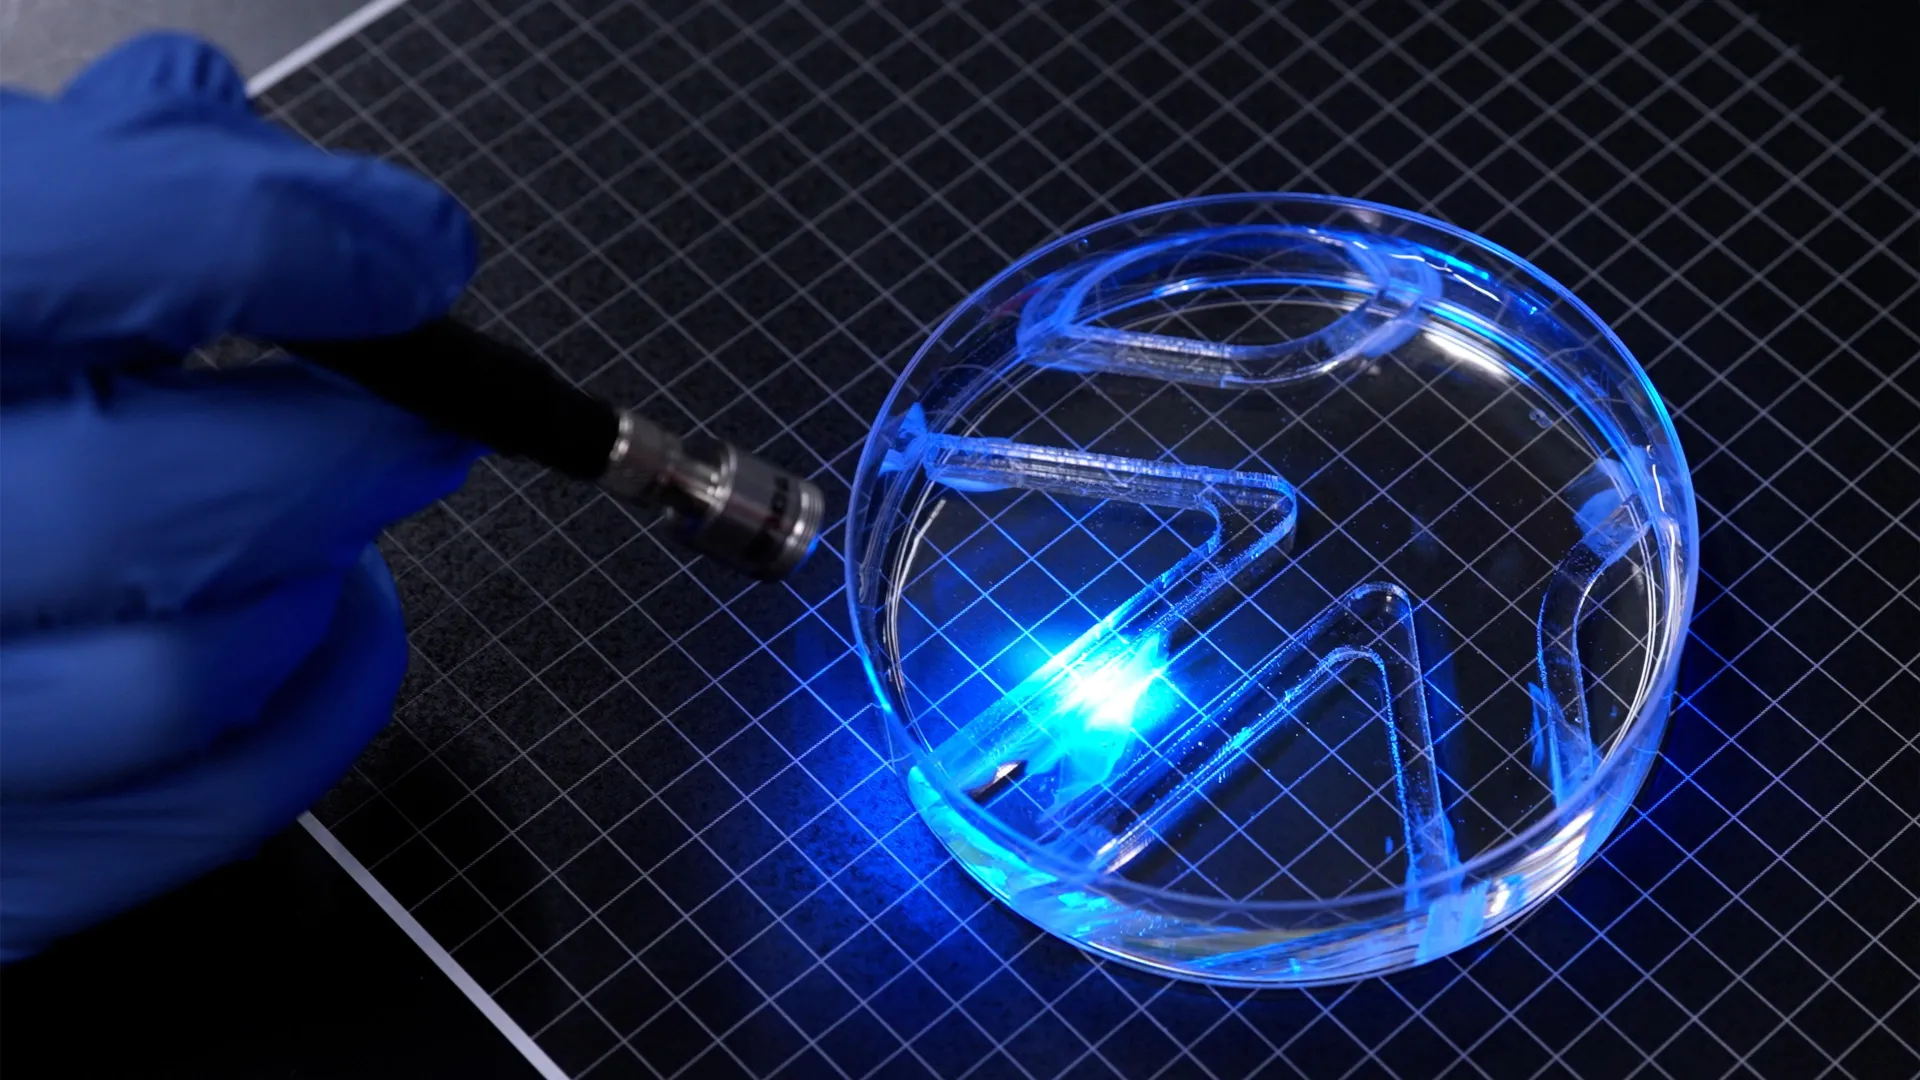
MIT scientists build a tiny robot that swims using living muscle cells
MIT engineers have built a paper-thin swimming robot powered by living muscle cells that respond to flashes of light, allowing it to swim and steer through water. The breakthrough could pave the way for tiny, self-healing biological robots capable of exploring fragile environments that ordinary machines cannot safely navigate.
Matthew Cole on Vegan Sociology, Ethics, Transhumanism and Technology
“Every time technology tries to stand in for ethics, we do ourselves a disservice… we deny ourselves the opportunity for growth.”
Dr. Matthew Cole said that to me in late 2020. At the time, we were talking about vegan meat. Read it again with AI in mind.
Matthew is a criminologist at The Open University and the only #vegan sociologist I know. He studies how we raise children to love animals and eat them at the same time, and how that contradiction gets quietly filed under “normal.”
Over two hours, we went from thrash metal guitar to Doctor Who, breaching experiments, David Pearce’s Hedonistic Imperative, and the human exceptionalism hiding inside a lot of #transhumanism. He also changed how I think about the small daily inconveniences of my own choices.
If you’re certain you’re a predator, and nothing could change your mind, skip this one. Everyone else, a question worth sitting with: which of your ethical decisions are you hoping #technology will make for you?
The full 2-hour conversation with Dr. Matthew Cole, video and audio: [ https://snglrty.co/3ZN6fgl](https://snglrty.co/3ZN6fgl)

Exercise doesn’t just strengthen your heart. It rewires it
Regular exercise does more than strengthen the heart. New research reveals that it actually reshapes the nerves controlling how the heart functions, and the changes are surprisingly different on the left and right sides of the body.
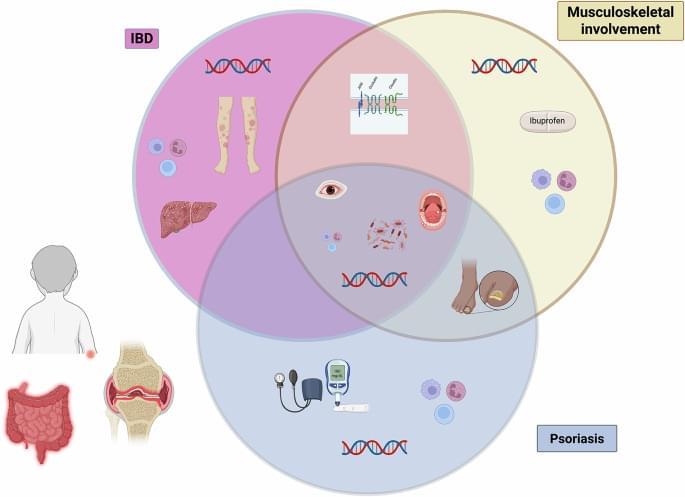
The intestinal microbiome in inflammatory bowel disease and spondyloarthritides
Alizadeh et al. review the shared links between inflammatory bowel disease and spondyloarthritis, with a focus on IBD-associated spondyloarthritis. There is a high degree of clinical overlap, and shared increases in gut permeability linked to altered microbiota and metabolites, suggesting those as common pathways driving disease.

Low-power neural chip reads brain signals to identify cognitive and emotional states
Deep brain stimulation (DBS) is a therapeutic technique that delivers electrical pulses to specific areas of the brain via an implant to modulate neural activity. It is already widely used for movement disorders such as Parkinson’s disease, and researchers are increasingly exploring its potential for severe psychiatric illnesses including major depression, posttraumatic stress disorder and obsessive-compulsive disorder.
However, most existing DBS systems operate in what engineers call an “open loop” manner: stimulation is delivered according to predefined settings rather than continuously adapting to the patient’s brain activity. Even among closed-loop, or adaptive, systems, many rely on signals recorded from a single brain region. This is a major limitation for psychiatric disorders, where clinically relevant information may be distributed across networks of interacting brain regions.
“Our work is based on the growing body of research suggesting that psychiatric disorders arise more from disruptions in communication between brain regions than from dysfunction of any single region,” explains Mahsa Shoaran, head of the Integrated Neurotechnologies Lab in EPFL’s School of Engineering and Neuro-X Institute.