Can sleep improve language learning? New neuroscience explains how sleep strengthens vocabulary, pronunciation, and memory.


In this work, Vigo et al. demonstrate that norepinephrine (NE) promotes myeloid hematopoiesis in BM and regulates thymic Tregs via B3ARs in EAE. B3ARs are controlled by hypothalamic AgRP neurons, which are dysfunctional in EAE. Serum levels of AgRP are elevated in people with MS and correlate with disease severity.

Memories and learning processes are based on changes in the brain’s neuronal connections and, as a result, in signal transmission between neurons. For the first time, DZNE researchers have observed an associated phenomenon in living brains – specifically in mice. This mechanism concerns the cellular pulse generator for neuronal signals (the “axonal initial segment”) and had previously only been documented in cell cultures and in brain samples. A team led by neuroscientist Jan Gründemann reports on this in the journal Nature Neuroscience, alongside experts from Switzerland, Italy, and Austria. Their study sheds light on the brain’s ability to adapt. Next, the researchers intend to investigate the significance of these findings in Alzheimer’s disease.
In the brain, neurons branch out and connect with each other to form a network through which electrical signals are actively exchanged. This network structure is an essential component of the brain’s “hardware” and is therefore fundamental to its function, especially with regard to learning processes and memory formation. However, this complex architecture and signal transmission across this network are not fixed; they can change as a result of experiences and events. This flexibility, also known as neuroplasticity, is the basis for the brain’s ability to adapt.
As memories are formed, the brain changes in measurable ways: synaptic “pulse generators” grow and shrink, revealing surprising insights from brain research.


Researchers at Ottawa Hospital Research Institute and University of Ottawa found that high risk of obstructive sleep apnea was associated with approximately 40% higher odds of a composite poor mental health outcome at baseline and follow-up among adults aged 45–85 years in the Canadian Longitudinal Study on Aging.
Identifying factors associated with mental health outcomes is an important goal on several fronts. Mental health conditions rank among the leading contributors to global disease burden, with anxiety and depressive disorders described as most common. Individuals living with mental health conditions face higher risks of cardiometabolic diseases, unemployment, homelessness, disability, and hospitalizations. Economically, mental disorders carry an estimated $1 trillion annual global cost in lost productivity.
Obstructive sleep apnea (OSA) involves repeated upper airway narrowing during sleep. Disturbed breathing can break up sleep (sleep fragmentation), trigger a stress response in the nervous system (sympathetic activation), and cause episodes of low oxygen in the blood (intermittent hypoxemia).

For more than 50 years, scientists have sought alternatives to silicon for building molecular electronics. The vision was elegant; the reality proved far more complex. Within a device, molecules behave not as orderly textbook entities but as densely interacting systems where electrons flow, ions redistribute, interfaces evolve, and even subtle structural variations can induce strongly nonlinear responses. The promise was compelling, yet predictive control remained elusive.
Meanwhile, neuromorphic computing—hardware inspired by the brain—has followed a parallel ambition: to discover a material that can store information, compute, and adapt within the same physical substrate and in real time. Yet today’s dominant platforms, largely based on oxide materials and filamentary switching mechanisms, continue to behave as engineered machines that emulate learning, rather than as matter that intrinsically embodies it.
A new study from the Indian Institute of Science (IISc) published in Advanced Materials suggests that these two long-standing challenges may finally converge.

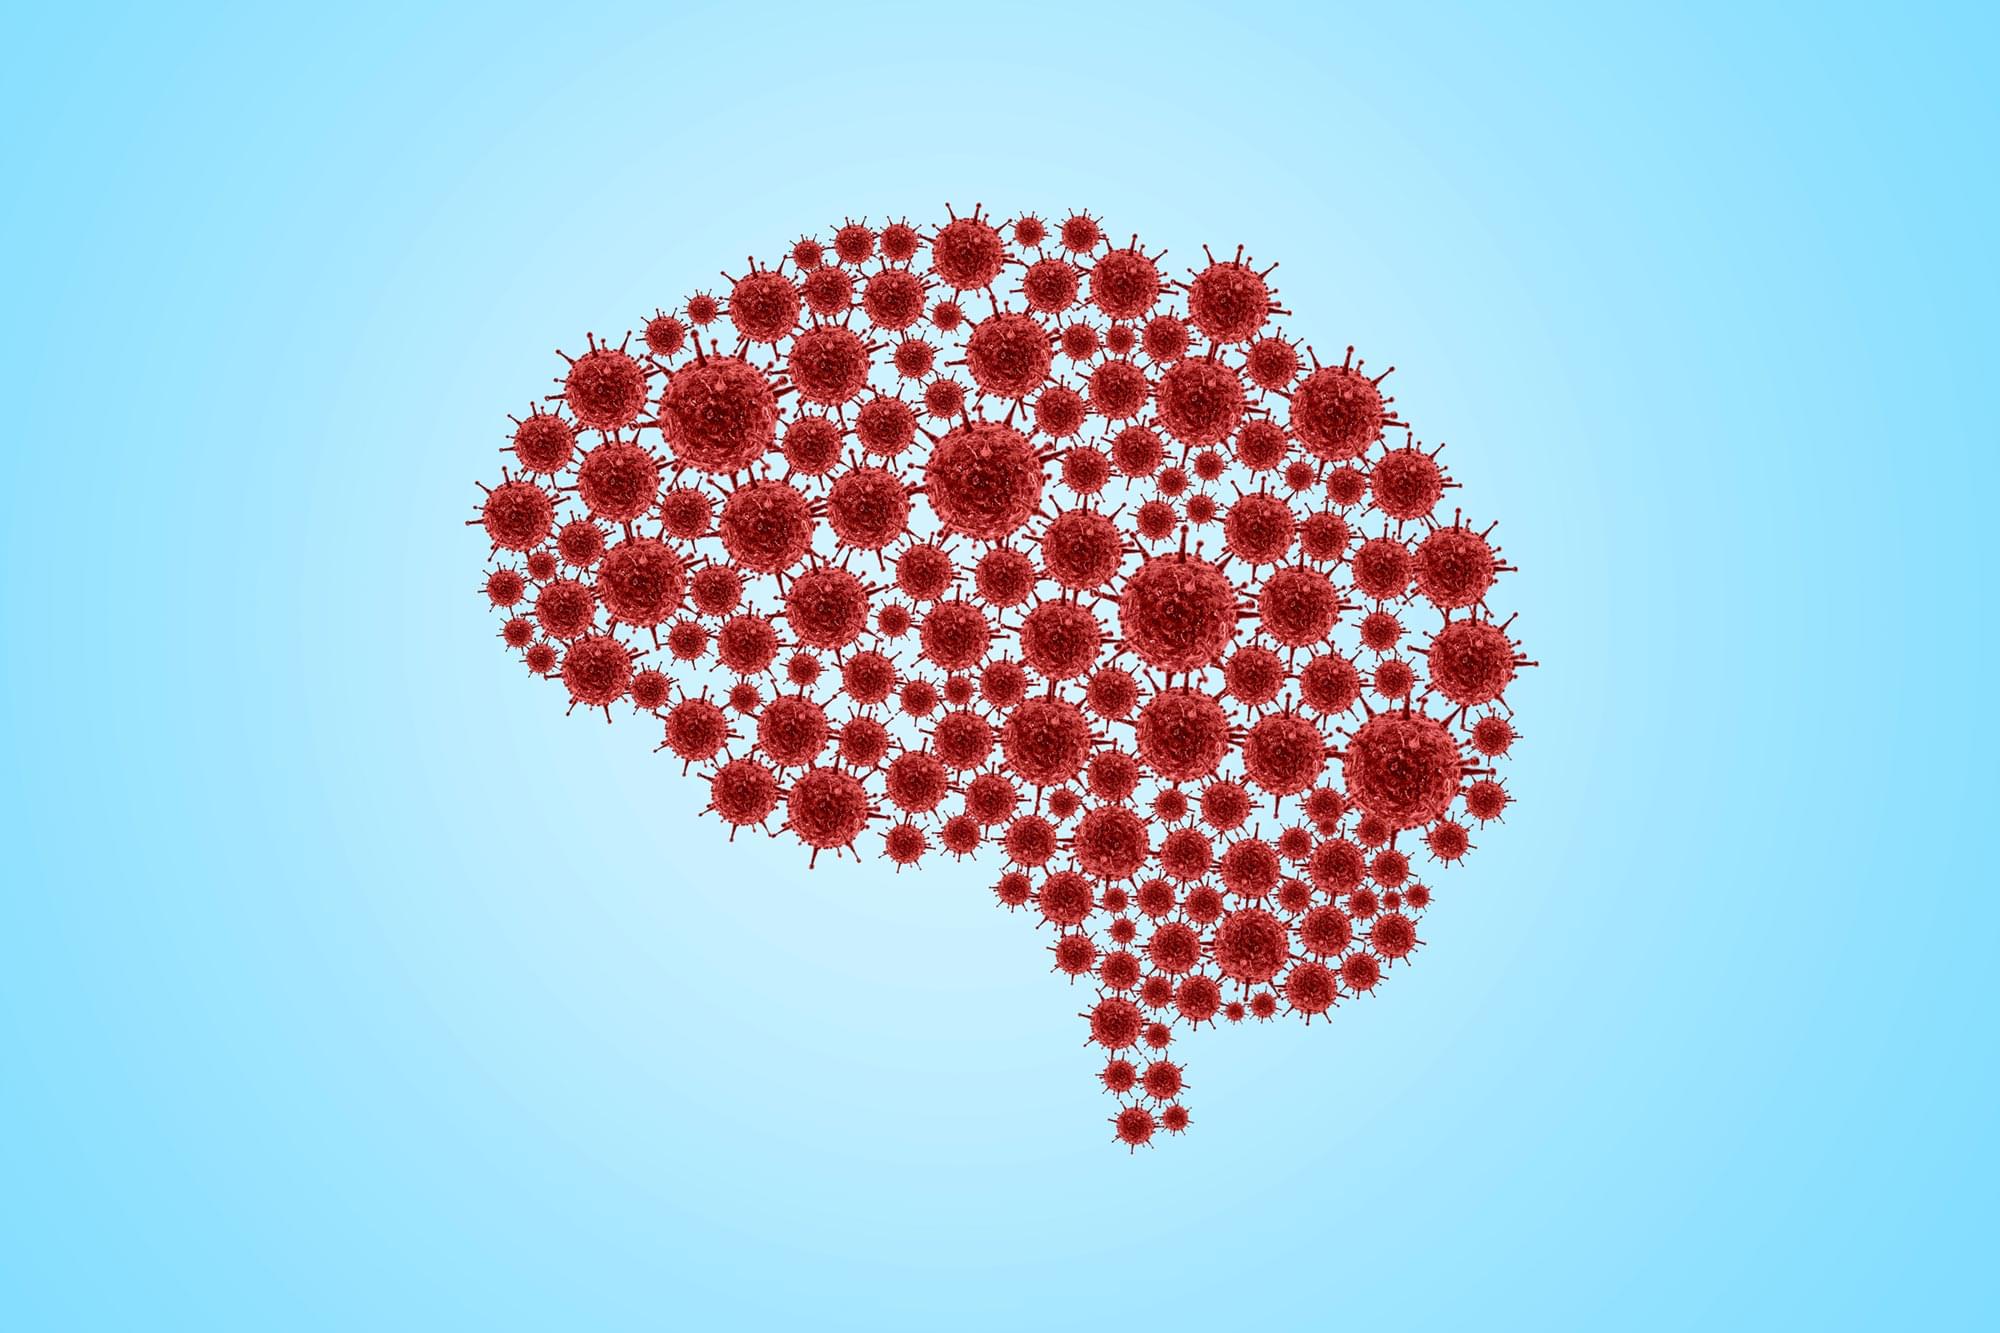
Summary: Advanced imaging reveals that COVID-19 may cause lasting brain changes, even in people without ongoing symptoms, pointing to hidden neurological effects that could persist long after recovery.
COVID-19 affects more than the lungs. Research shows that even after people have fully recovered from the infection, the virus can cause significant changes in the brain, underscoring its lasting effects on neurological health.
COVID-19 is widely recognized for its impact on the lungs, but growing evidence shows that the virus can also cause lasting changes in the brain, even in people who have fully recovered. These findings point to potential long-term neurological consequences that extend beyond the acute phase of the illness.
