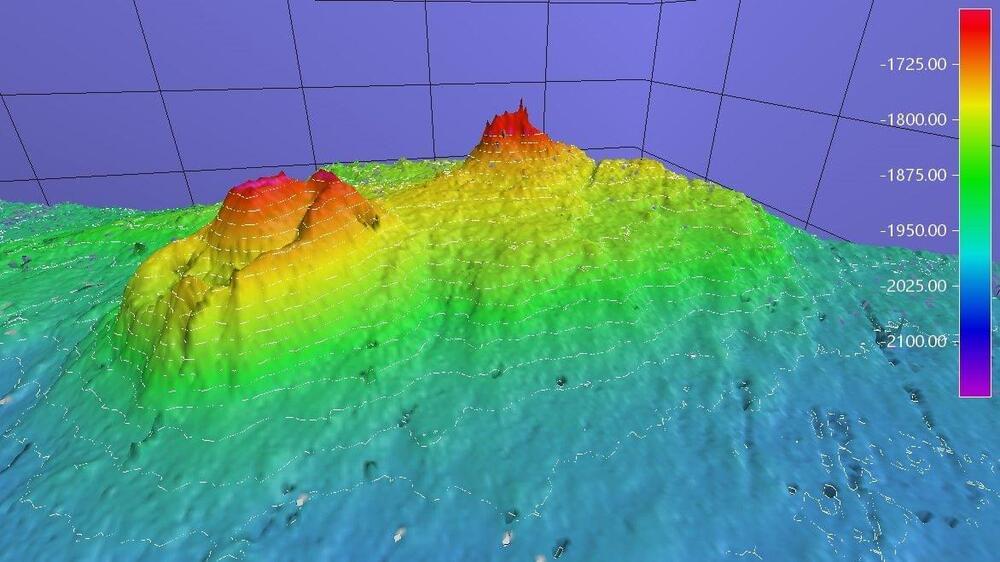
Mapping in the Chukchi and Beaufort seas off Alaska has uncovered a 1,640-foot-tall structure on the seafloor, but scientists say it’s too early to determine the nature of the discovery.
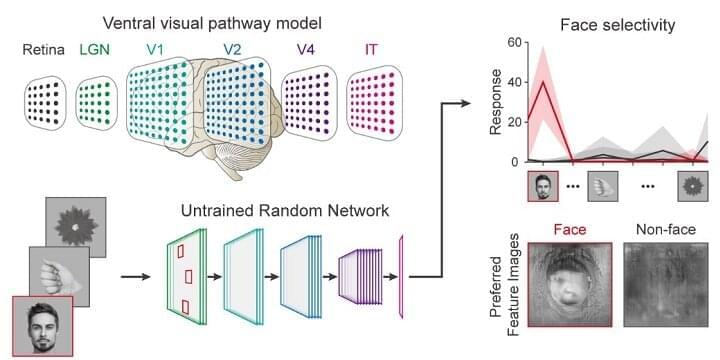
Researchers have explained how the regularly structured topographic maps in the visual cortex of the brain could arise spontaneously to efficiently process visual information. This research provides a new framework for understanding functional architectures in the visual cortex during early developmental stages.
A KAIST research team led by Professor Se-Bum Paik from the Department of Bio and Brain Engineering has demonstrated that the orthogonal organization of retinal mosaics in the periphery is mirrored onto the primary visual cortex and initiates the clustered topography of higher visual areas in the brain.
This new finding provides advanced insights into the mechanisms underlying a biological strategy of brain circuitry for the efficient tiling of sensory modules. The study was published in Cell Reports on January 5.
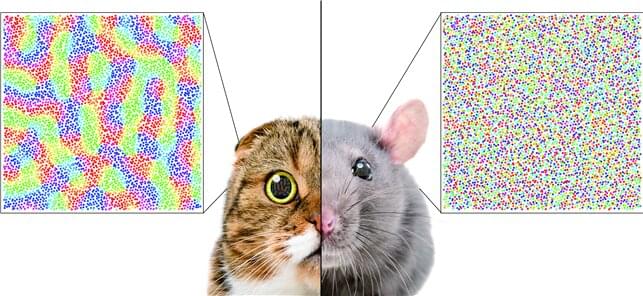
Researchers have explained how visual cortexes develop uniquely across the brains of different mammalian species. A KAIST research team led by Professor Se-Bum Paik from the Department of Bio and Brain Engineering has identified a single biological factor, the retino-cortical mapping ratio, that predicts distinct cortical organizations across mammalian species.
This new finding has resolved a long-standing puzzle in understanding visual neuroscience regarding the origin of functional architectures in the visual cortex. The study, published in Cell Reports on March 10, demonstrates that the evolutionary variation of biological parameters may induce the development of distinct functional circuits in the visual cortex, even without species-specific developmental mechanisms.
In the primary visual cortex (V1) of mammals, neural tuning to visual stimulus orientation is organized into one of two distinct topographic patterns across species. While primates have columnar orientation maps, a salt-and-pepper type organization is observed in rodents.

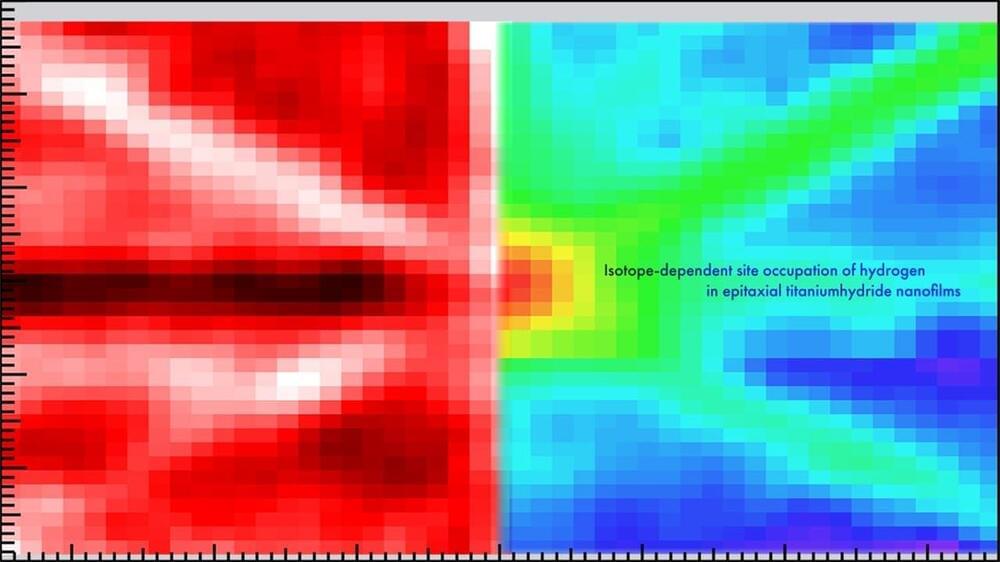
Researchers have developed a method to precisely locate hydrogen atoms within nanofilams, a breakthrough with significant implications for superconductivity and other material properties.
Their study, employing nuclear reaction analysis and ion channeling, revealed how hydrogen and its isotopes are distributed within titanium nanofilms, offering insights into tuning the material properties for various applications including hydrogen storage and catalysis.
Impact of hydrogen on material properties.
This finding, published in Science, was demonstrated by researchers from the Max Planck Institute of Animal Behavior, the Cluster of Excellence Center for the Advanced Study of Collective Behavior at the University of Konstanz, Germany, Tel Aviv University, and the Hebrew University of Jerusalem, Israel.
Would you be able to instantly recognize your location and find your way home from any random point within a three-kilometer radius, in complete darkness, with only a flashlight to guide you?
Echolocating bats face a similar challenge, with a local and directed beam of sound—their echolocation —to guide their way. Bats have long been known for their use of echolocation to avoid obstacles and orient themselves.
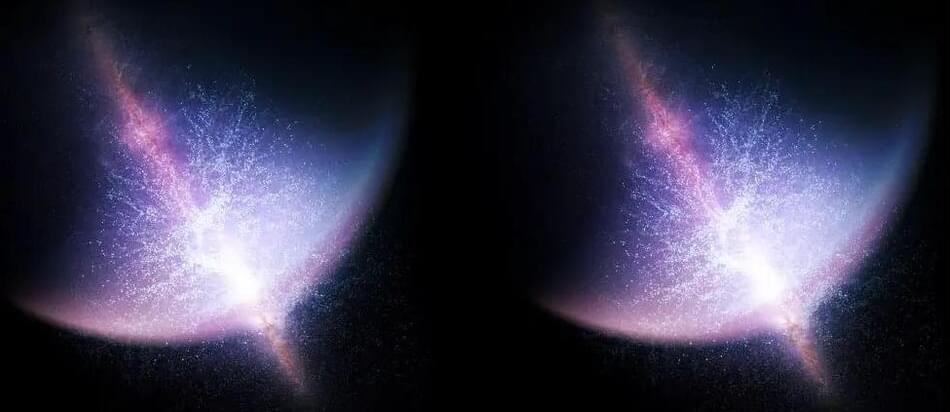
A newly discovered crescent of galaxies spanning 3.3 billion light-years is one of the world’s largest known structures, challenging some of astronomers’ most fundamental assumptions about the universe.
The epic arrangement known as the Giant Arc is made up of galaxies, galaxy clusters, and a lot of gas and dust. It is located 9.2 billion light-years away and stretches across roughly a 15th of the observable universe.
Its discovery was “serendipitous,” according to Alexia Lopez, a doctoral candidate in cosmology at the University of Central Lancashire (UCLan) in the United Kingdom. Lopez was creating maps of things in the night sky using light from approximately 120,000 quasars, which are distant brilliant cores of galaxies where supermassive black holes consume material and produce energy.
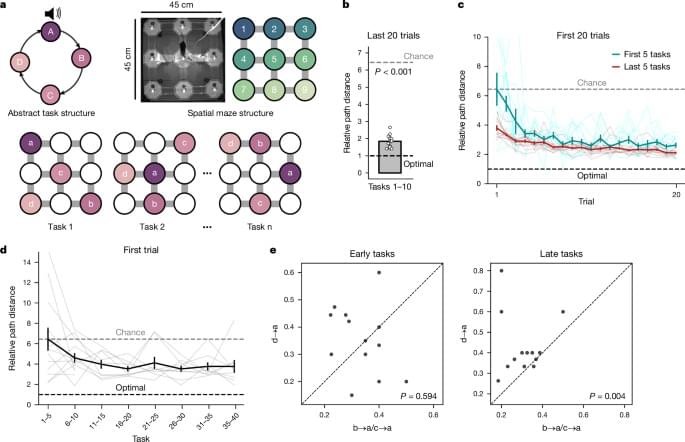
A published today https://nature.com/articles/s41586-024-08145-x reveals brain cells can form a coordinate system for our behaviours.
Mice generalize complex task structures by using neurons in the medial frontal cortex that encode progress to task goals and embed behavioural sequences.
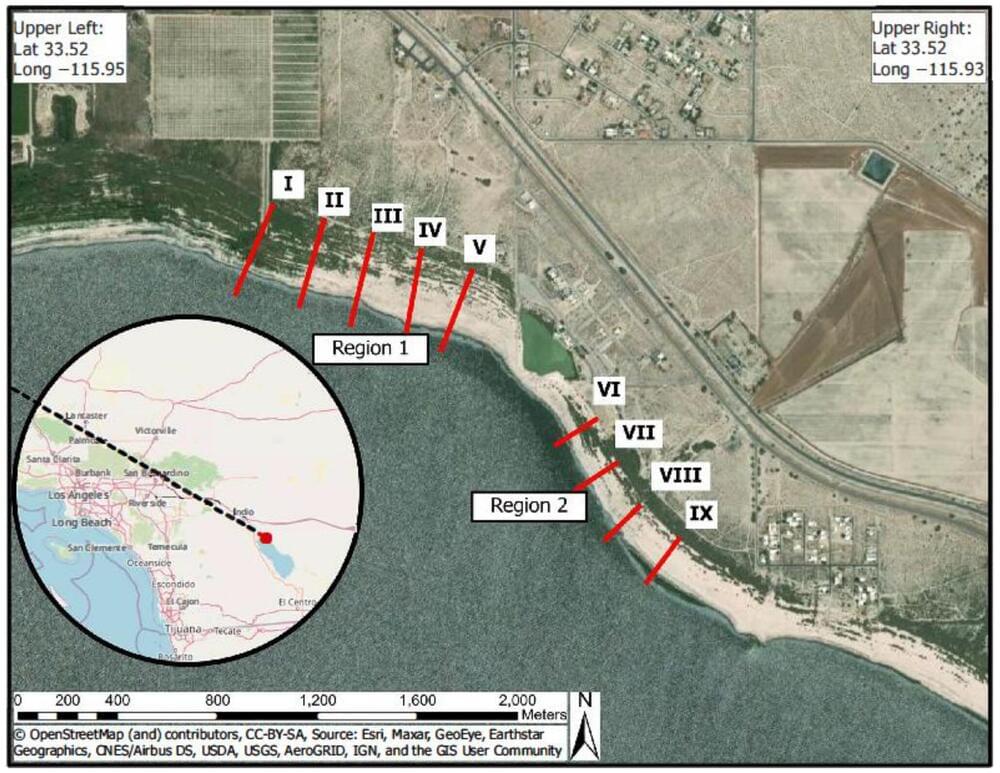
The Salton Sea, California’s largest lake by surface area, is experiencing an increasing rate of shoreline retreat following a policy change that shifted more water from the Colorado River to San Diego, according to a newly published study. The resulting dried lakebed is creating more polluted dust from dried agricultural runoff that affects nearby communities, researchers said.
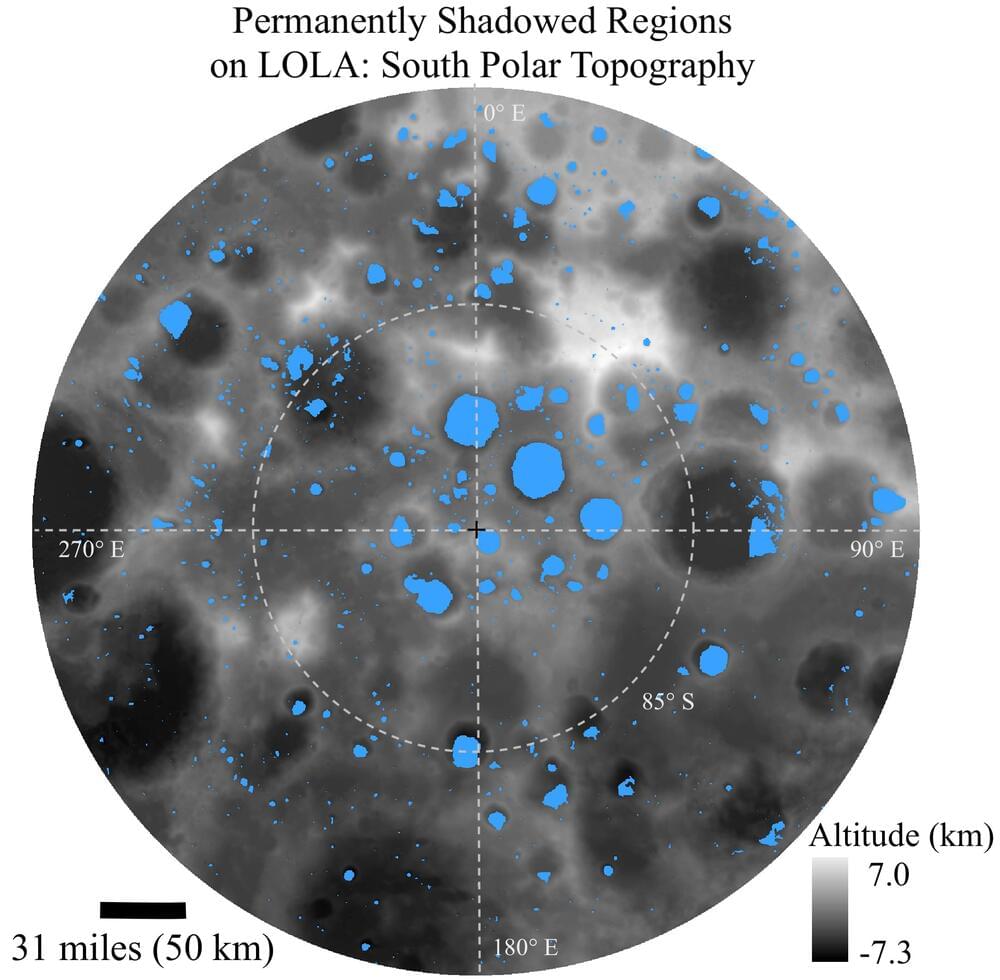
Deposits of ice in lunar dust and rock (regolith) are more extensive than previously thought, according to a new analysis of data from NASA’s LRO (Lunar Reconnaissance Orbiter) mission. Ice would be a valuable resource for future lunar expeditions. Water could be used for radiation protection and supporting human explorers, or broken into its hydrogen and oxygen components to make rocket fuel, energy, and breathable air.
Prior studies found signs of ice in the larger permanently shadowed regions (PSRs) near the lunar South Pole, including areas within Cabeus, Haworth, Shoemaker and Faustini craters. In the new work, “We find that there is widespread evidence of water ice within PSRs outside the South Pole, towards at least 77 degrees south latitude,” said Dr. Timothy P. McClanahan of NASA’s Goddard Space Flight Center in Greenbelt, Maryland, and lead author of a paper on this research published October 2 in The Planetary Science Journal.
The study further aids lunar mission planners by providing maps and identifying the surface characteristics that show where ice is likely and less likely to be found, with evidence for why that should be. “Our model and analysis show that greatest ice concentrations are expected to occur near the PSRs’ coldest locations below 75 Kelvin (−198°C or −325°F) and near the base of the PSRs’ poleward-facing slopes,” said McClanahan.