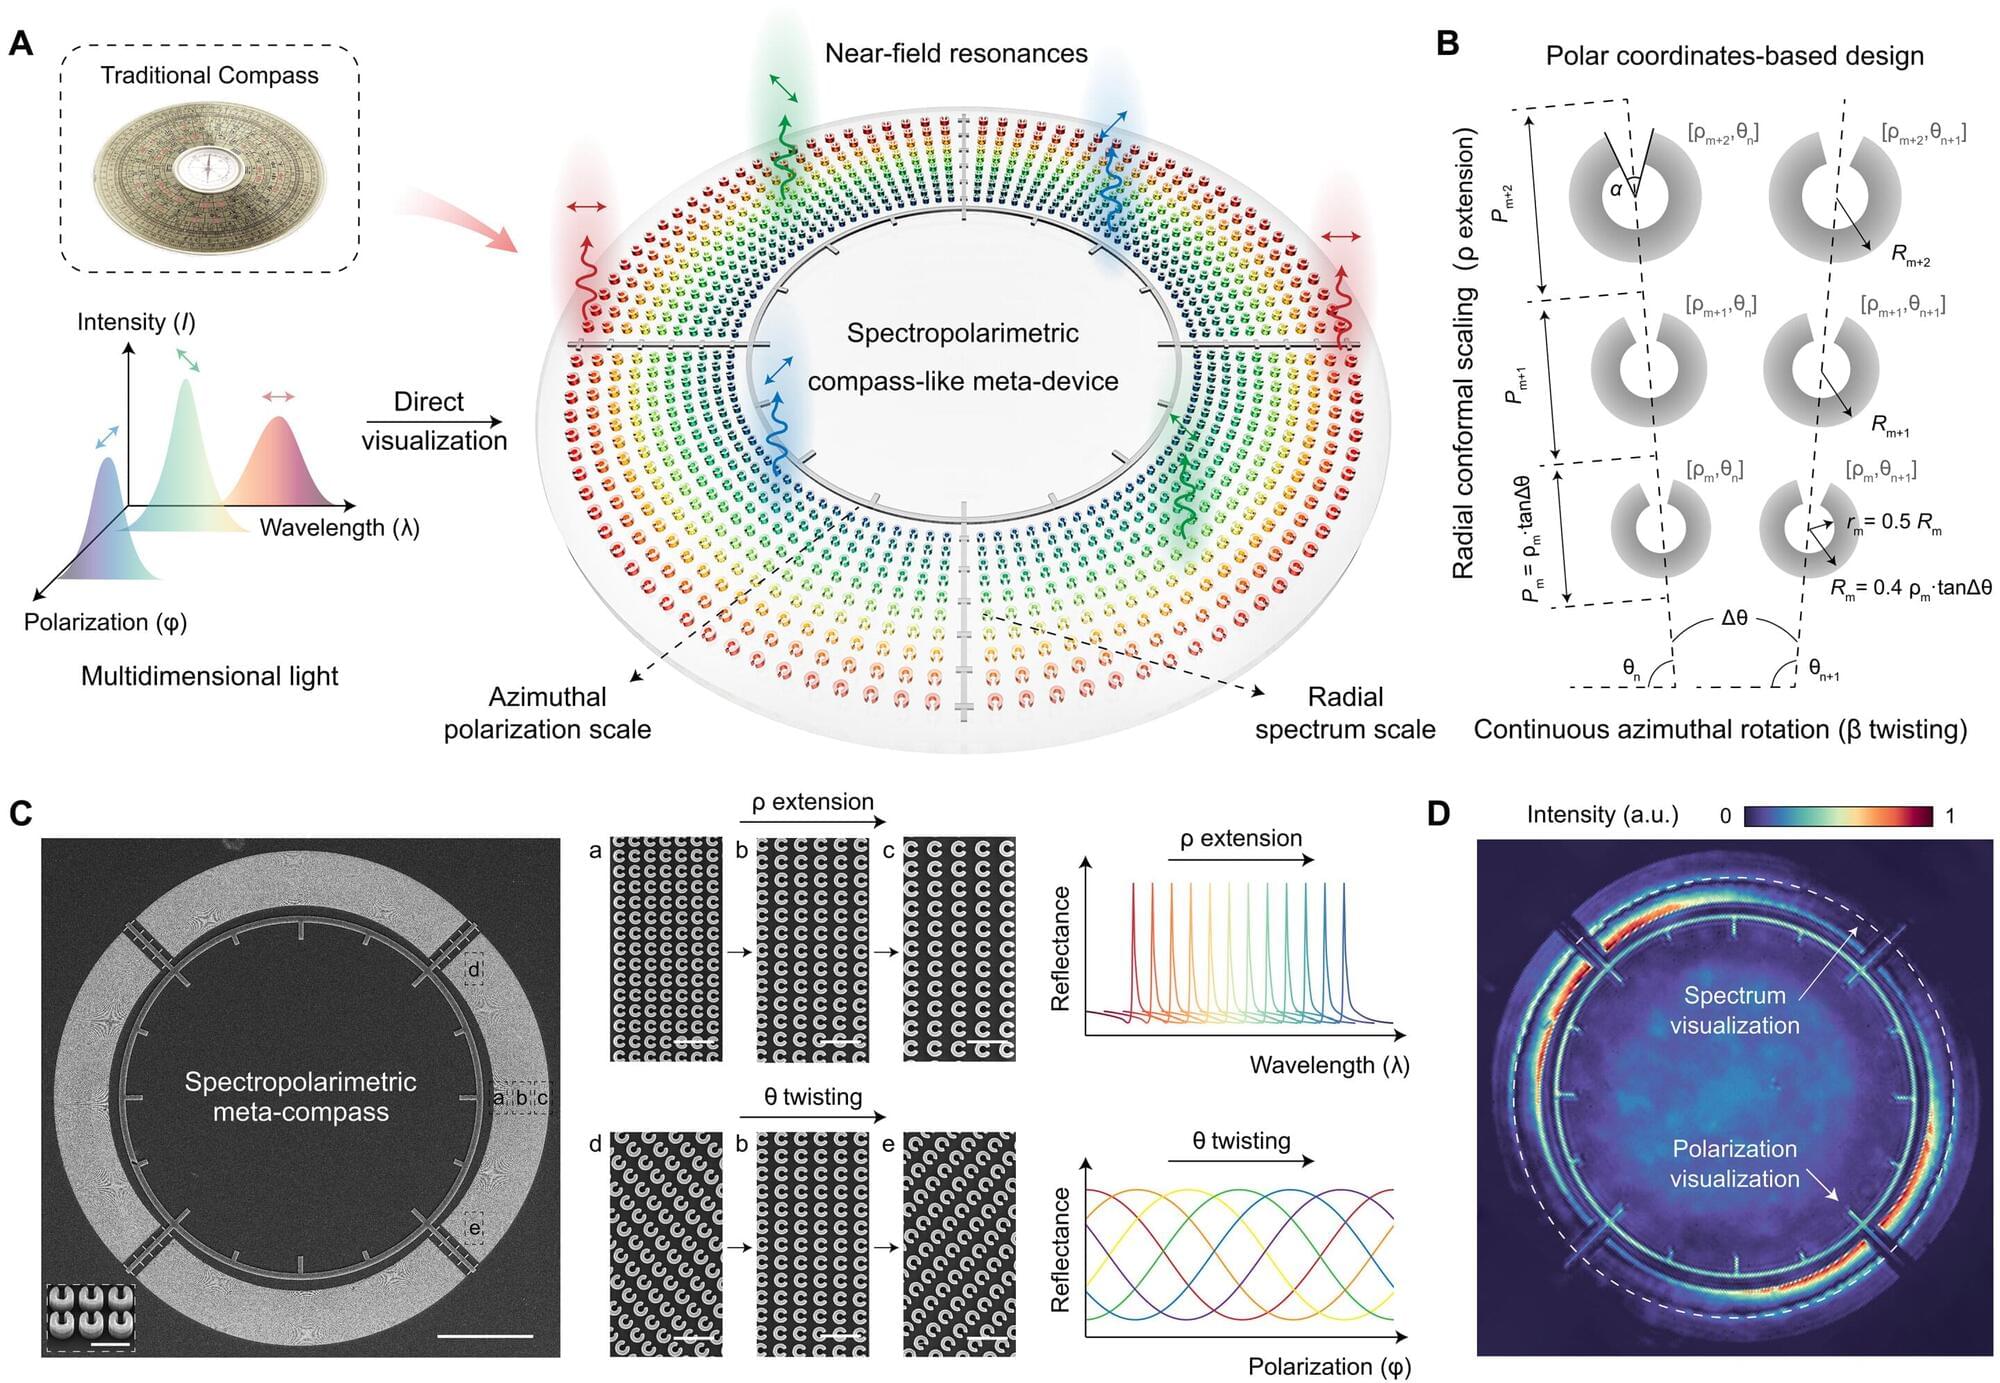
A ruler turns length into a position on a scale. A thermometer converts temperature into the height of a liquid column. In each case, a physical quantity becomes easier to read because an instrument gives it a visible reference. We wanted to bring the same idea to light, whose properties are usually measured with separate optical components and then interpreted through additional data processing.
Light carries several kinds of information at once. Its spectrum describes how optical power is distributed across wavelength, while its polarization describes the orientation and character of the electric-field oscillation. These properties can reveal complementary aspects of a material or scene. Yet measuring them together is not straightforward. A spectrometer separates wavelengths, and a polarimeter analyzes polarization. Combining the two measurements can require multiple components, careful calibration and computational reconstruction.
Our approach is to give these two properties their own spatial coordinates. In a compact, compass-like metasurface, wavelength is represented by radial position, while linear-polarization orientation is represented by azimuthal angle. Instead of treating the measured image as an indirect collection of intensity values, we designed the device so that the pattern itself carries a readable optical scale. Our research is published in the journal Science Advances.