Myeloid subclustering resolved 19 distinct populations (Figure 3D), including dendritic cells (DCs), monocytes, neutrophils, and various macrophage subsets (Figure S3C, Table S4). Rapamycin altered macrophage composition, increasing Il1bhi inflammatory macrophages while reducing Nlrp3hi and Ccr2hi subsets, and decreasing Trem2hi macrophages, whereas foam-like macrophages were slightly increased. In line with our flow cytometry data, neutrophil clusters were consistently reduced, while dendritic cells and mast cells were not affected. Although subset-specific variation was observed, inflammatory gene signatures (Table S5) within Nlrp3hi and Mox macrophages were overall reduced in rapamycin-treated mice (Figure 3E).
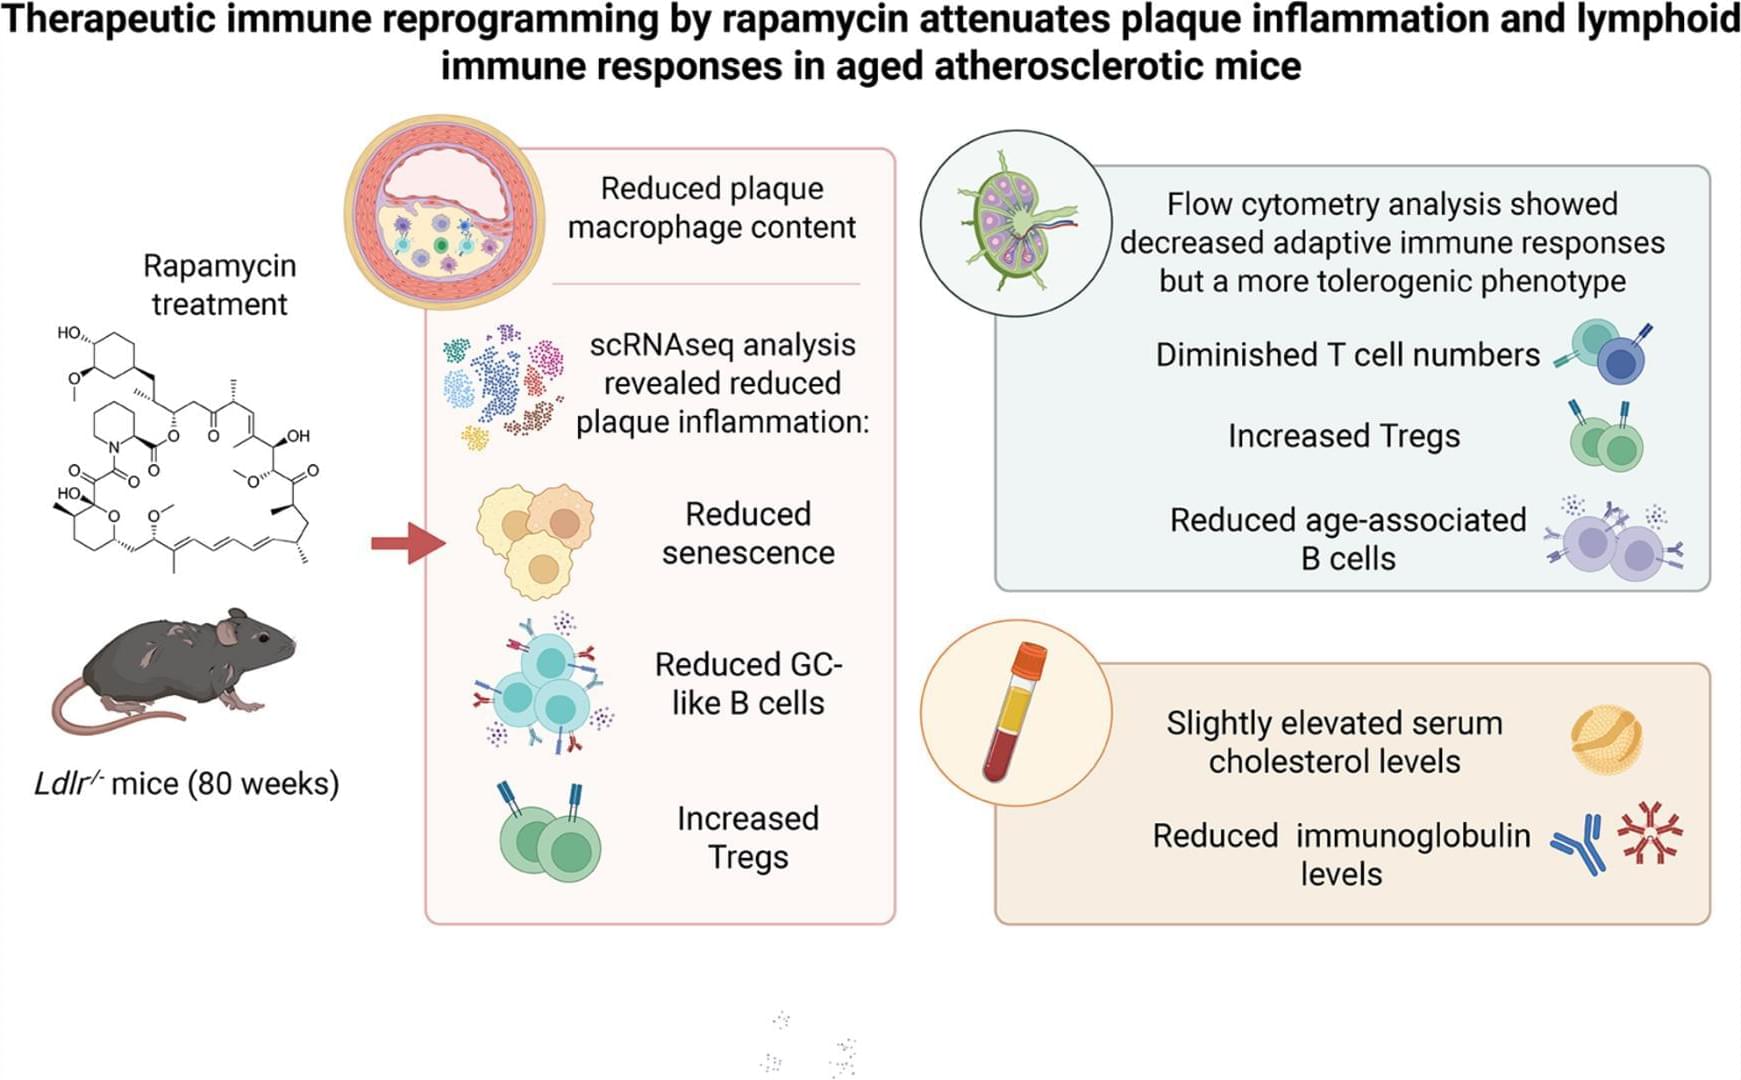
B cell and plasma cell subclustering identified 10 different subsets (Figure 3F, Figure S3D, E, Table S6). While most B2-like (cluster 0 and 1; Fcer2a, Cr2), activated (cluster 3; Mychi Egr3hi), and memory (cluster 4; Bach22+, Cd83+) B cell populations were relatively unchanged, rapamycin reduced resting B cells (cluster 5; ribosomal genes) and B1/Breg-like cells (cluster 2; S100a6, Ebi3, Cd9). Strikingly, cluster 6, enriched for proliferating germinal center (GC) B cell markers (Mef2b, Aicda, Fas, Mki67), suggesting these cells are derived from GCs, were nearly absent following rapamycin treatment, accompanied by a reduction in plasma cells (cluster 9; Jchain, Prdm1, Sdc1, Xbp1). Consistently, expression of plasma cell-and immunoglobulin-related genes (e.g., Jchain, Sdc1, Iglc1, and Ighg2c) was reduced (Figure 3G), indicating suppression of antigen-driven humoral responses.
In-depth analysis of conventional T cells revealed 14 subpopulations (Figure 3H, Table S7), broadly separating into CD4+ and CD8+ T populations (Figure S3F, G). Rapamycin drastically reduced effector memory CD4+ (cluster 6; Cd44hi, Sell−, Junlow) and CD8+ (clusters 0 and 7; Gzmk+, Toxhi, and cluster 3; Gzmahi, Gzmbhi) T cell subsets, while increasing naïve (clusters 1 and 4; Cd44low, Sell+, Jun+) and central memory (cluster 5: Cd44+, Sell+) subsets. Proliferating (cluster 11; Mki67, Top2a, Hells) and IFN-induced CD8+ T cells (cluster 13; Ifit1, Ifit3, Ifi204) remained largely unaffected, whereas apoptotic/dying CD8+ T cells (cluster 8; mitochondrial genes, Malat1) were nearly absent after rapamycin treatment. Importantly, Tregs (cluster 9; Foxp3, Tnfrsf4, Ctla4) were preserved and showed elevated expression of Foxp3 and Tgfb1 (Figure 3I), together with enrichment of IL-10 and CTLA-4 signaling pathways (Figure 3J), indicating enhanced immunoregulatory activity.