Online now:(Cell Metabolism 36, 2402–2418.e1–e10; November 5, 2024)
Online now: (Cell Metabolism 36, 2402–2418.e1–e10; November 5, 2024)
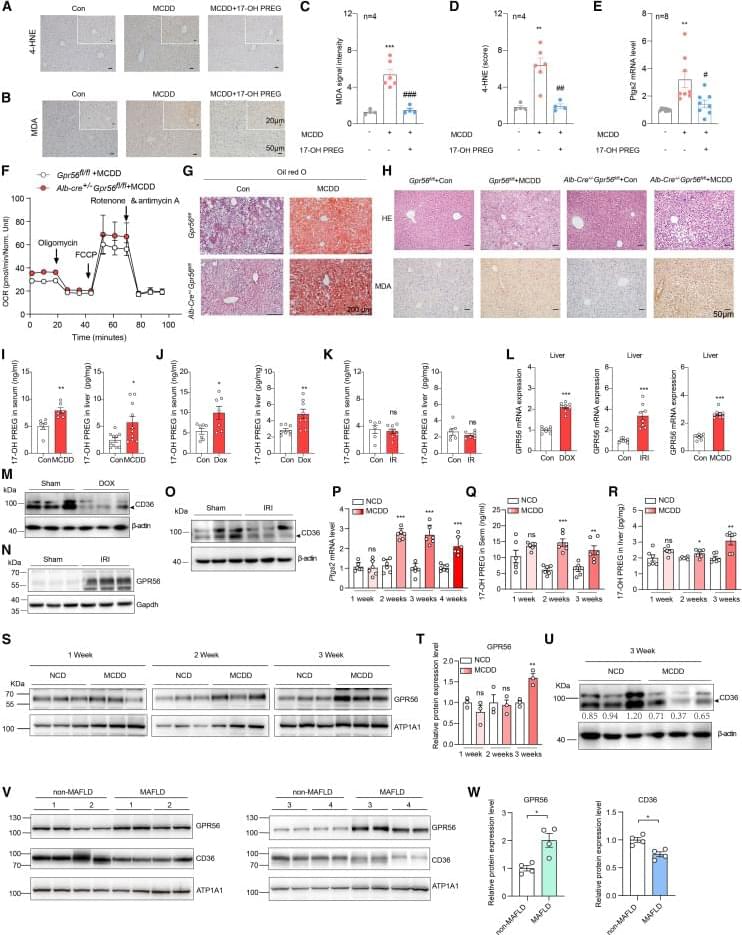
In the originally published article, due to figure preparation mistakes, there were errors in Figures 2, 3, and S9. Specifically, the line legends in Figure 2J were accidentally lost during the creation of the figure using AI software, the marker positions for the β-actin bands in Figure 3J were incorrectly labeled, the H&E staining image of the wild-type mouse DOX+17-OH PREG treatment group in Figure S9A was erroneously pasted during figure compilation, and the IHC staining image of the liver ischemia-reperfusion treatment group in Figure S9I was flipped during copying. We apologize for these oversights that occurred during the many revisions.
Because certain western bands were not clear, we corrected Figures 2C and 3G with full-membrane original data. In addition, CD36 appears to be over 100 kDa in Figure S10S, whereas it is consistently between 70 and 100 kDa in all other figures. We have previously encountered similar problems with certain proteins with a little difference in molecular weight, and we have solved this issue by using other lysis buffers. Therefore, we used another lysis buffer (epizyme CAT: PC201) to examine whether there is a consistent phenotype of CD36 between 70 and 100 kDa. As expected, we detected a significant decrease of CD36 located within 70–100 kDa upon IR, Dox, and MCDD treatment, which was consistent with our published data of CD36 above 100 kDa. Because the major CD36 band should appear at approximately 88 kDa based on numerous studies, we have removed the original data from Figure S10S and presented the corrected bands in Figure S10U to avoid confusion.