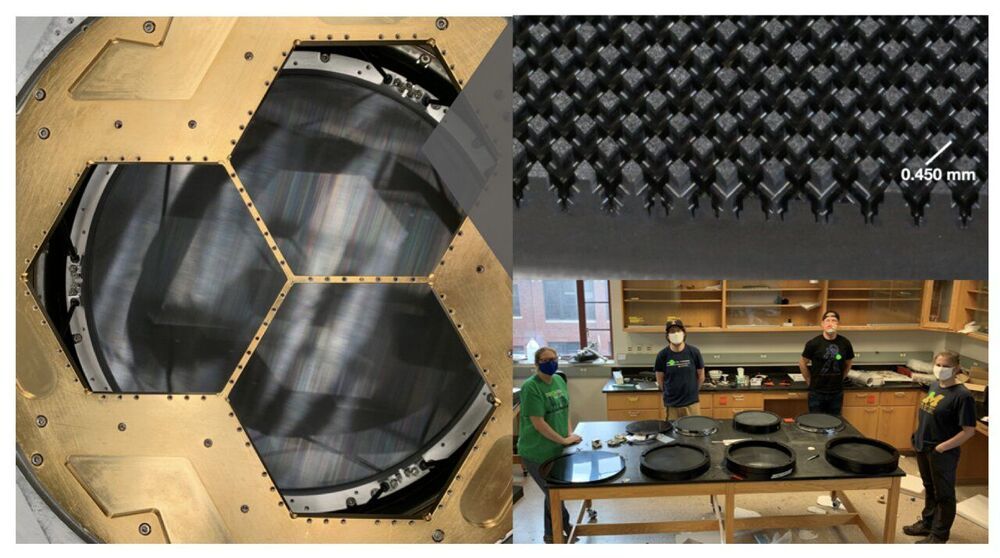
The cosmic microwave background, or CMB, is the electromagnetic echo of the Big Bang, radiation that has been traveling through space and time since the very first atoms were born 380000 years after our universe began. Mapping minuscule variations in the CMB tells scientists about how our universe came to be and what it’s made of.
If we know a protein’s structure, we can make educated guesses about its function. And by mapping thousands of protein structures, we can begin to decipher the biology of life.
The researchers conducted a series of government-funded surveys from 2011 to 2020 and located potentially high-yield deposits of various essential industrial minerals from nickel to rare earths, according to a paper published in the Chinese-language Bulletin of Mineralogy, Petrology and Geochemistry last week.
Chinese researchers have spent the last decade mapping the globe’s ocean floors looking for potential mineral deposits.
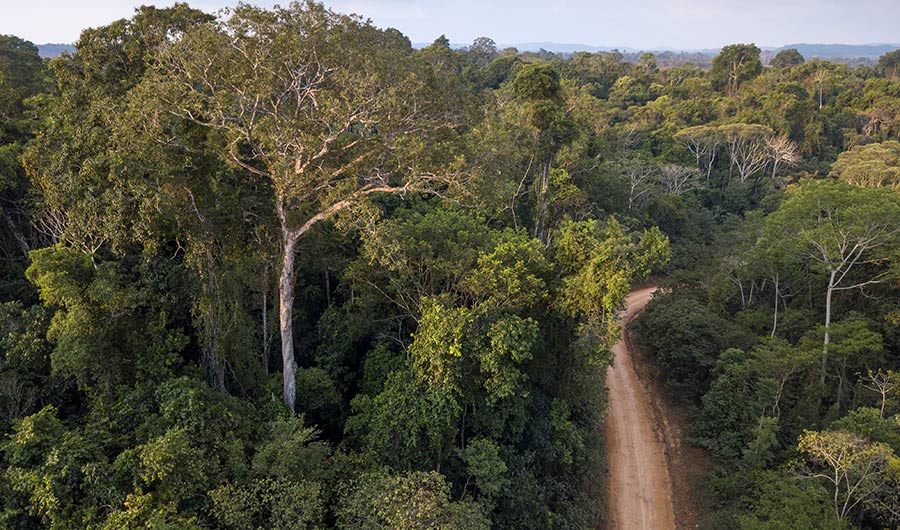
(Inside Science) — It took years of painstaking work for Carlos Souza and his colleagues to map out every road in the Brazilian Amazon biome. Official maps of the 4.2 million-square-kilometer region only show roads built by federal and local governments. But by carefully tracing lines on satellite images, the researchers concluded in 2016 that the true length of all the roads combined was nearly 13 times higher.
“When we don’t have a good understanding of how much roadless areas we have on the landscape, we probably will misguide any conservation plans for that territory,” said Souza, a geographer at a Brazil-based environmental nonprofit organization called Imazon.
Now, Imazon researchers have built an artificial intelligence algorithm to find such roads automatically. Currently, the algorithm is reaching about 70% accuracy, which rises to 87%-90% with some additional automated processing, said Souza. Analysts then confirm potential roads by examining the satellite images. Souza presented the research last month at a virtual meeting of the American Geophysical Union.
Using data from the Large Sky Area Multi-object Fiber Spectroscopic Telescope (LAMOST) and ESA’s star-mapping satellite Gaia, astronomers have discovered 591 new high-velocity stars in the halo of our Milky Way Galaxy.
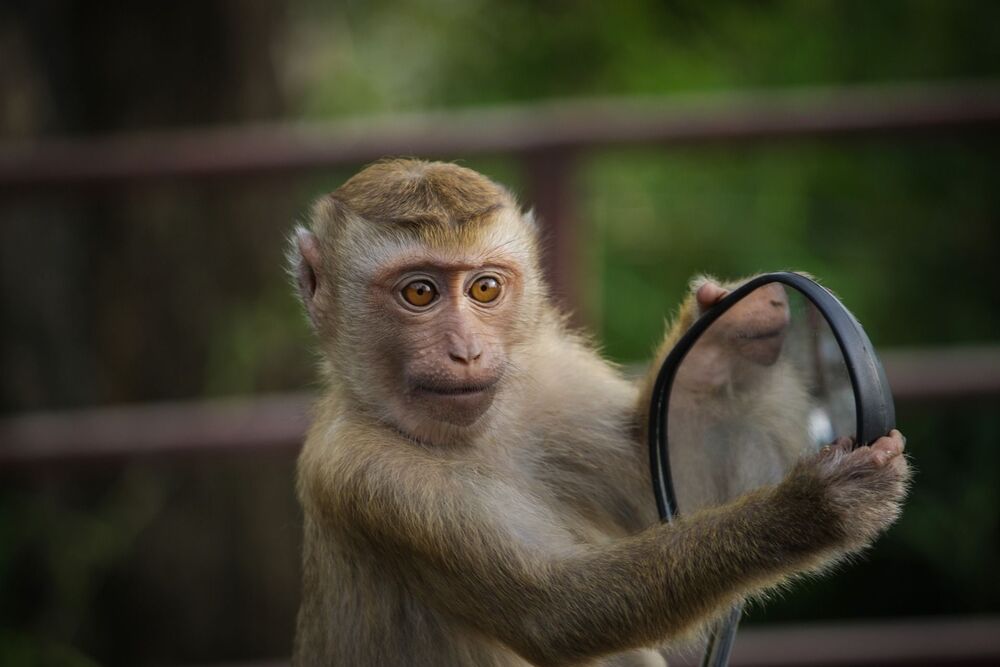
A pair of monkeys were able to “see” and recognize individual letter shapes generated by arrays of electrodes implanted in their brains – without using their eyes. Previously, sight-restoring implants were placed in the retina, but these new implants were placed in the visual cortex. They achieved the highest resolution yet for such technology.
The visual cortex is like a cinema screen in our skull, with each area on its surface mapping to the visual field. Placing a patch of electrodes on the surface that activate like pixels will make a person “see” whatever points get activated. For example, if an L-shaped pattern of electrodes in contact with the visual cortex is activated, they will see a pixelated L.
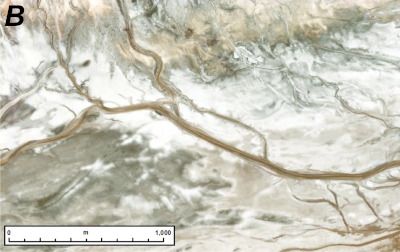
Navigating and mapping rivers has long been a central component in human exploration. Whether it was Powell exploring the Colorado’s canyons or Pizarro using the Amazon to try to find El Dorado, rivers, and our exploration of them, have been extremely important. Now, scientists have mapped out an entirely new, unique river basin. This one happens to be on an entirely different planet, and dried up billions of years ago.
Three to four billion years ago, Mars did in fact have running rivers of water. Evidence for these rivers has shown up in satellite imagery and rover samples for almost as long as we have been exploring the red planet. Since Mars has little tectonics or erosion, that evidence has remained somewhat intact until the present day.
Recently, a team of scientists developed a tool to better examine those features. They managed to stitch together an 8-trillion pixel image of the entire Martian surface. Each pixel in this incredibly detailed image represents about a 5–6 square meter area. Unfortunately, it also doesn’t seem to available to the general public just year. Whether it is or not it is sure to prove useful for a variety of research projects regarding the environment of Mars. One of the first ones, which was recently published a paper in Geology was a map of the red planet’s river “ridges”.
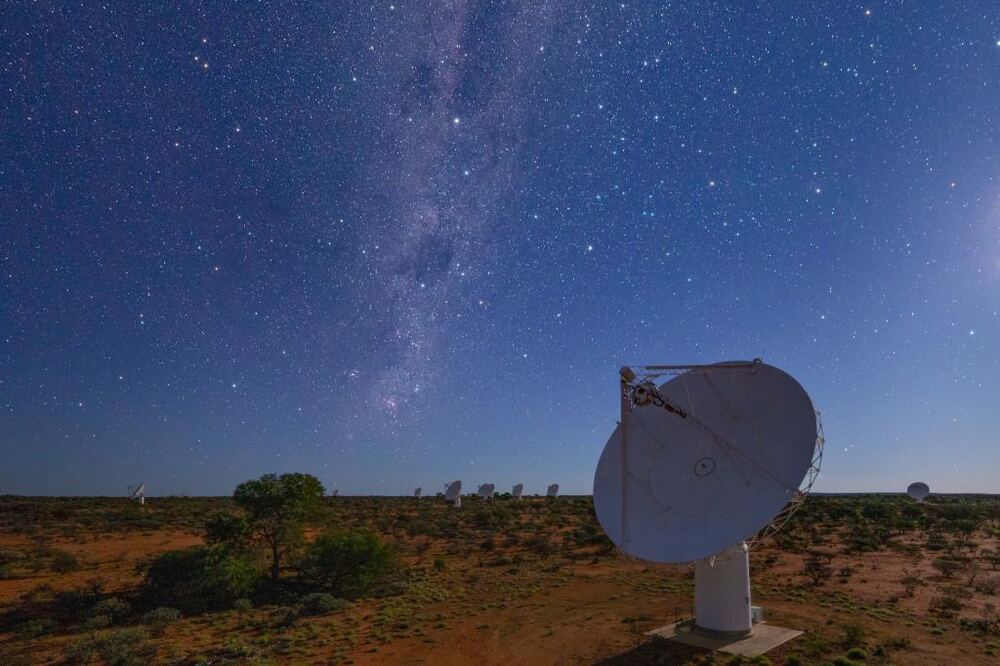
CSIRO has made a detailed radio survey of the southern hemisphere, and discovered a million new galaxies.
Although radio astronomy has been around since the 1930s, it is only in recent years that astronomers have been able to make high-resolution maps of the radio sky. Sky maps are difficult for radio telescopes because radio antennas need to be focused on an extremely small patch of sky to capture images in high resolution. But with modern antennas and computer processing, we can now scan the sky quickly enough to map the heavens in a reasonable amount of time.
In the northern hemisphere, the most detailed radio sky maps have been done by the Very Large Array (VLA). In the 1990s the VLA made the first full-sky surveys of the northern sky. After its upgrade in the 2000s, the observatory began the VLA Sky Survey (VLASS), which has mapped nearly 10 million radio sources.
The location of the VLA lets it observe about 80% of the sky, but it cannot see the southern sky very well. For that, you’d need a radio observatory in the southern hemisphere. Fortunately, there is now a powerful radio telescope array in Australia, and it has recently made a detailed radio map.
DroneSeed will be allowed to operates drones beyond visual line of sight.
DroneSeed, a company that uses fleets of drones to reforest areas burned in wildfires, received approval in October from the Federal Aviation Administration (FAA) for its heavy-lift drones to operate Beyond Visual Line of Sight (BVLOS) and to expand its use of heavy-lift drone swarms to California, Colorado, Montana, Nevada, Arizona and New Mexico.
The FAA’s action allows DroneSeed to begin reforesting once a fire is contained and airspace is clear. Their aircraft drop seeds that are encapsulated in vessels consisting of four to six seeds, fertilizer, natural pest deterrents, and fibrous material which absorbs water and increases survivability.
The company has designed a system around a swarm of drones that can drop tree seeds in places where they have a decent chance of survival. First they survey the area with a drone using lidar and a multispectral camera to map the terrain and the vegetation. Software then identifies areas with invasive species or other plants the landowner wants to eliminate that could compete with the new trees. Then a drone can apply herbicide to only the patches that need it, rather than dumping pesticide over the entire landscape. The next step is to use artificial intelligence to sort through the mapping data to find areas where a dropped seed is most likely to germinate, in order to avoid, for example, rock, roads, and unburned locations. After the aircraft is launched, it operates autonomously flying a grid pattern with five drones.
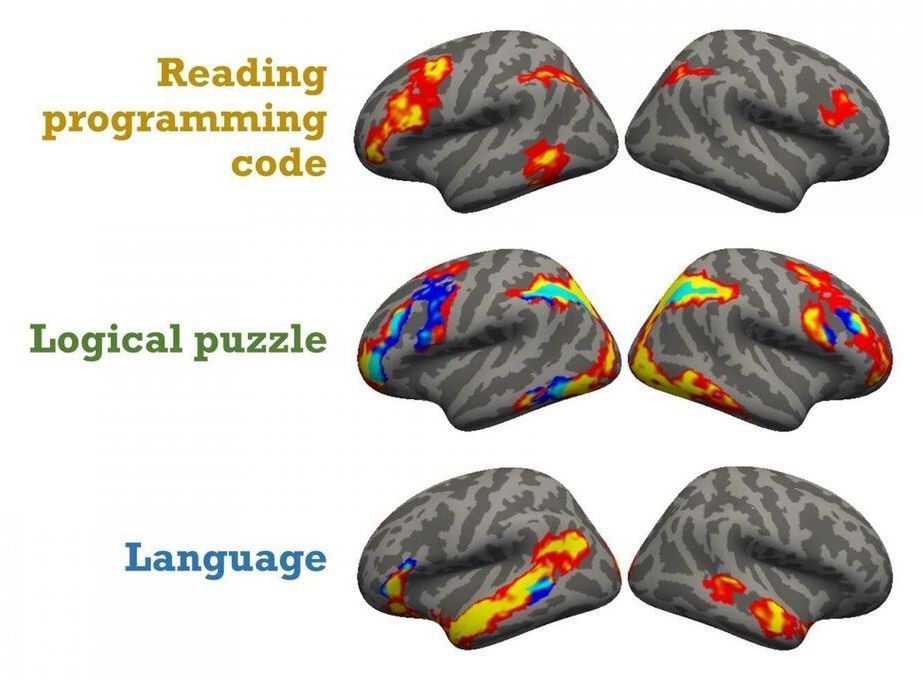
“People want to know what makes someone a good programmer,” Liu said. “If we know what kind of neuro mechanisms are activated when someone is programming, we might be able to find a better training program for programmers.” By mapping the brain activity of expert computer programmers while they puzzled over code, Johns Hopkins University scientists have found the neural mechanics behind this increasingly vital skill.
Though researchers have long suspected the brain mechanism for computer programming would be similar to that for math or even language, this study revealed that when seasoned coders work, most brain activity happens in the network responsible for logical reasoning, though in the left brain region, which is favored by language.
“Because there are so many ways people learn programming, everything from do-it-yourself tutorials to formal courses, it’s surprising that we find such a consistent brain activation pattern across people who code,” said lead author Yun-Fei Liu, a Ph.D. student in the university’s Neuroplasticity and Development Lab. “It’s especially surprising because we know there seems to be a crucial period that usually terminates in early adolescence for language acquisition, but many people learn to code as adults.”