Dr. Isaac Asimov was a prolific science fiction author, biochemist, and professor. This was recorded in 1982. Asimov was best known for his works of science fiction and for his popular science essays. Born in Russia in 1920 and brought to the United States by his family as a young child, he went on to become one of the most influential figures in the world of speculative fiction. He wrote hundreds of books on a variety of topics, but he’s especially remembered for series like the \.
Category: futurism – Page 336
The Cruel, Post-Human Universe of Humanity Lost (feat. @azfk )
From the mind of Callum Diggle comes a bleak outlook for humanity, set hundreds of years in the future. The universe of Humanity Lost is one we’d we’d barely recognize, but there is a lot to discover. In today’s video, we’ll discuss a few of the events that led to humanity’s downfall, as well as exploring some of the new forms of life that await us.
For ad-free, extended editions, EXCLUSIVE videos, and more, check out my Patreon!
▷ / thoughtpotato.
To keep up with the epic story of Humanity Lost, be sure to check out Callum Diggle’s links, and especially his Patreon:
▷ / callumstephendiggle.
▷ / callumstephendiggleart.
▷ / callumdiggle.
And make sure you check out Qalasaci’s artwork on DeviantArt!
▷ https://www.deviantart.com/qalasaci.
And finally, if you don’t pay a visit to AzFk’s channel, you are SEVERELY missing out:
▷ / @azfk.
Thanks to everyone who helped make this video possible!


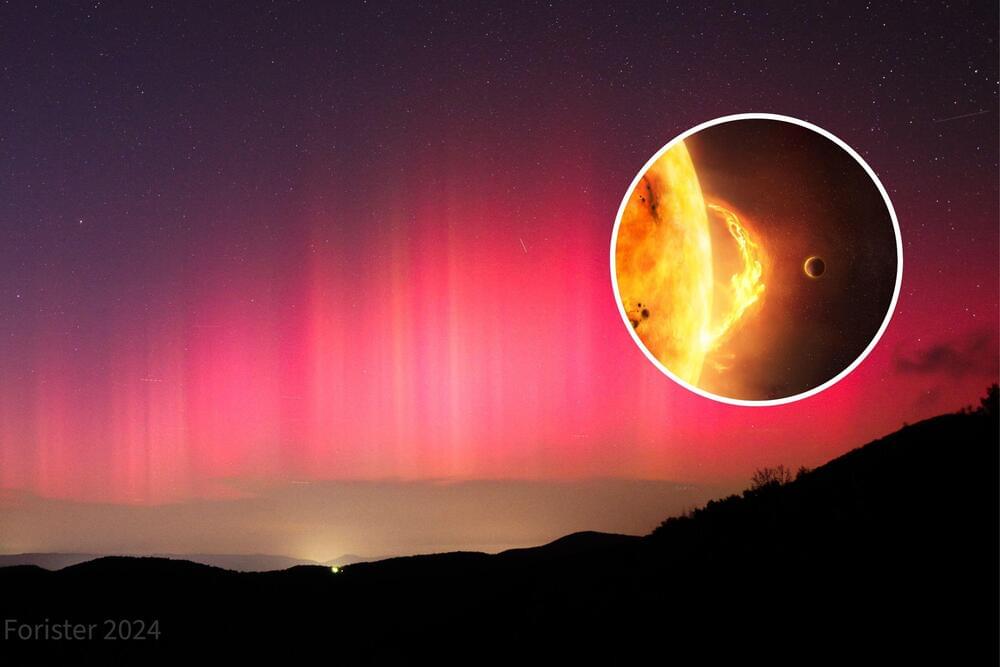
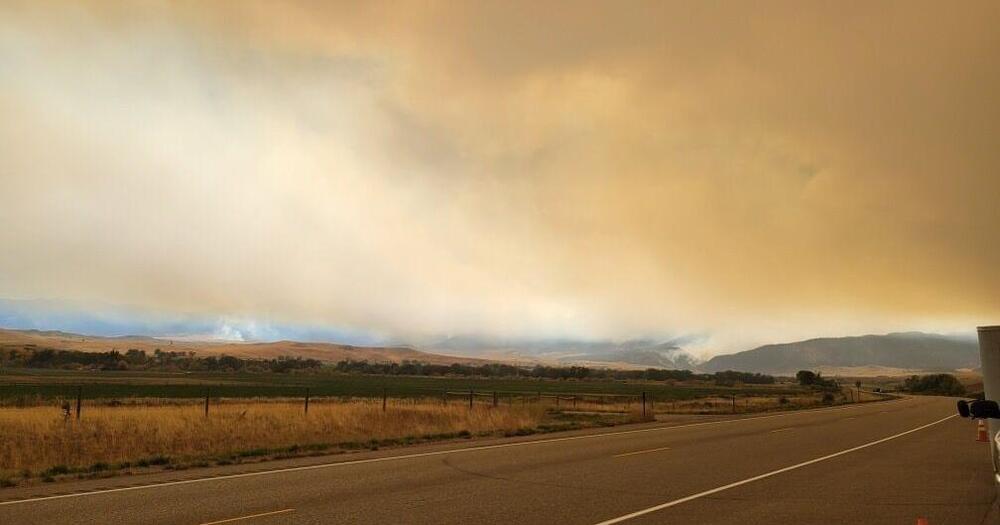
Earth in solar flare “crosshairs” after auroras lit up U.S. skies
Our planet might be hit by another massive solar flare Monday, following multiple northern lights sightings across the U.S. on Sunday night.
There is a 30 percent chance of an X-class solar flare hitting us on October 7, and a 75 percent chance of an M-class flare being seen, due to the Earth being in the “crosshairs” of six volatile sunspots on the sun’s surface.
This comes as 14 U.S. states caught a glimpse of the northern lights on Sunday night, thanks to a G1 to G2-strength geomagnetic storm.
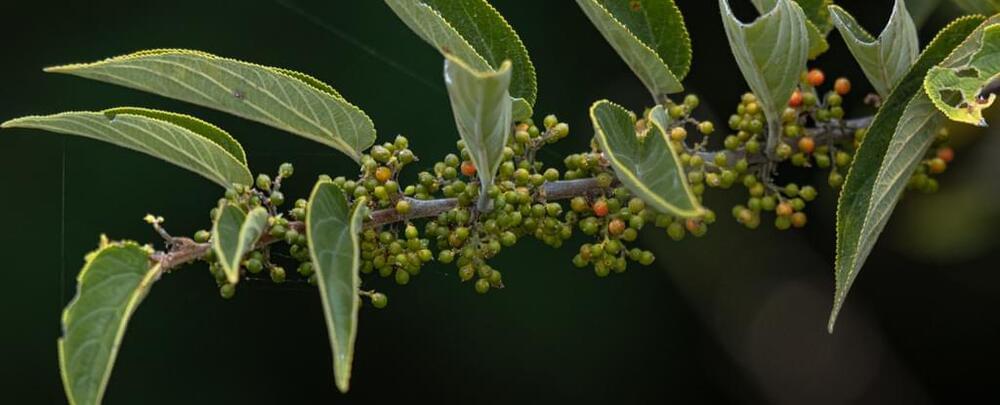
Scientists Found a Cannabis Compound Inside a Totally Different Plant
Scientists have discovered cannabidiol, a compound in cannabis known as CBD, in a common Brazilian plant, opening potential new avenues to produce the increasingly popular substance.
The team found CBD in the fruits and flowers of a plant known as Trema micrantha blume, a shrub which grows across…
Hiding in plain sight!