As an initial step, we selected ARDs associated with hallmarks of aging. These included a total of 83 diseases linked to one or more hallmarks of aging, based on the taxonomy put forward in ref. 4 (Supplementary Table 2). Support for this taxonomy comes from multiple sources. Analyses of electronic health records from general practice and hospitalizations identified more than 200 diseases with incidence rates increasing with chronological age6,22. Researchers linked a subset of these ARDs to specific hallmarks of aging using several approaches: mining 1.85 million PubMed abstracts on human aging, identifying shared genes in the genome-wide association study catalog, conducting gene set enrichment analysis and analyzing disease co-occurrence networks within each hallmark4.
We confirmed the co-occurrence of ARDs within each hallmark in 492,257 participants from the UK Biobank study23. The presence of one ARD increased the risk of developing another ARD related to the same hallmark, with clustering coefficients ranging from 0.76 for LOP-specific ARDs to 0.92 for SCE-specific ARDs. These findings corroborated the hallmark-specific clustering of ARDs (Extended Data Figs. 3 and 4)23.
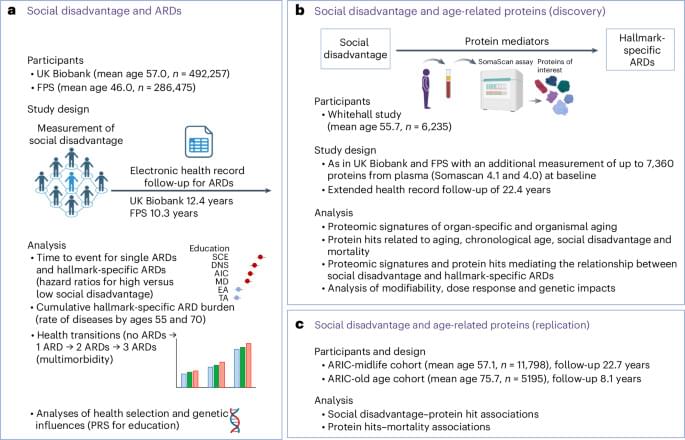
In time-to-event analyses of UK Biobank and FPS participants without these ARDs at baseline (n ranging from 477,325 to 492,294 in the UK Biobank and from 278,272 to 286,471 in the FPS, depending on the social disadvantage indicator and ARD), social disadvantage—indicated by education and adult SES (neighborhood deprivation)—was associated with a higher risk of developing ARDs. In the UK Biobank, the age-, sex-and ethnicity-adjusted hazard ratio for developing any ARD was 1.31 (95% confidence interval (CI) 1.29–1.33) for individuals with low compared with high education. For individuals with high versus low adult SES, the hazard ratio was 1.21 (95% CI 1.20–1.23). In the FPS, the corresponding hazard ratios were 1.28 (95% CI 1.25–1.31) and 1.23 (95% CI 1.20–1.27), respectively.