While shedding and symptom may not be closely linked in general, we found total shedding and symptom severity to be highly correlated (Pearson 0.81, Supplementary Fig. S1). Furthermore, with one exception, low shedding implied low symptom severity and vice versa. Thus associations found between shedding and pre-inoculation biomarkers like the CPV are also present in symptom severity, although to a lesser degree. Therefore in the rest of this section we report associations for the less noisy shedding measurements. The total variance explained (\(R^2\) ) by a linear model relating CPV score to shedding titers is \(R^2=0.77\) (ratio of residual variance of linear regression to variance of titers). Furthermore, a logistic regression of total shedding onto the CPV score yielded a perfect discriminant between high and low shedders, respectively defined as those whose total shedding is below versus above the population median.
The correlation between shedding titers and CPV scores is robust to reductions in the number of NCPT variables composing the score. In fact the correlation between shedding and CPV increases to greater than 0.9 when only 6 NCPT measures are incorporated: digSym-time, digSym-correct, reaction-time, posner-tutorialTime, trail-time and trail-tutorialTime. Furthermore, the CVP score incorporating only the three basic NCPT measures digSym-time, digSym-correct, trail-time achieves a correlation level of approximately 0.7 (Fig. S2). We find that adding a fourth basic NCPT variable reaction time to the CPV score computation does not appreciably affect this level of correlation. On the other hand, replacing replacing either digSym-time or digSym-correct with posner-tutorialTime produces an increase in correlation to a level greater than 0.85.
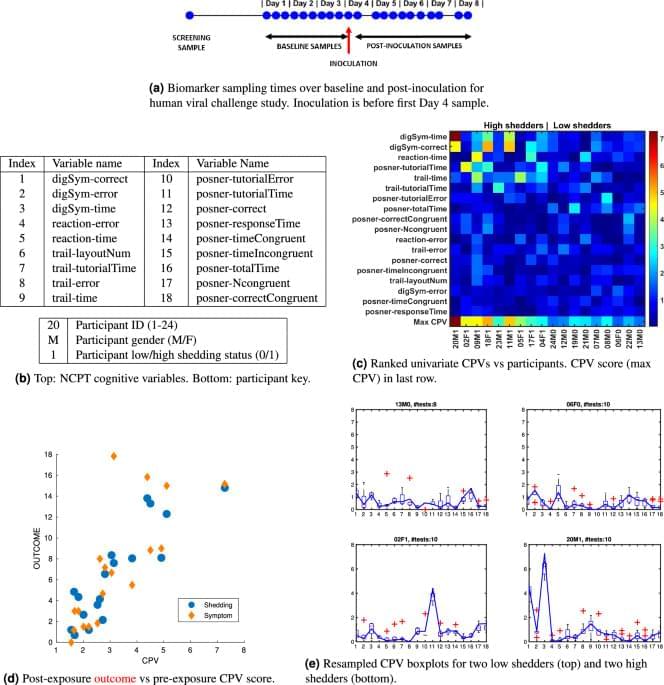
To illustrate the role of the 18 individual NCPT variables in the CPV, we plot in Fig. 1e the univariate CPV scores for the two lowest shedding and the two highest shedding participants. This figure is extracted from Fig. S3 in the Supplementary that shows the sequence of univariate CPV scores for all 18 study participants. Superimposed on the plot of these variables is a boxplot indicating score sensitivity to session perturbation, determined by leave-one-out analysis where the univariate CPV was recomputed after successively leaving a single NCPT session out of each participant’s sequence (sans screening session). Figure 1e clearly shows that certain NCPT variables have significantly higher variability for the high shedders (lower two panels) than for the low shedders (top two panels). Note that the NCPT variable with highest variability (variable achieving peak score in each panel of Fig. 1e) differs across study participants.