Background: To evaluate the electroretinogram waveform in autism spectrum disorder (ASD) and attention deficit hyperactivity disorder (ADHD) using a discrete wavelet transform (DWT) approach.
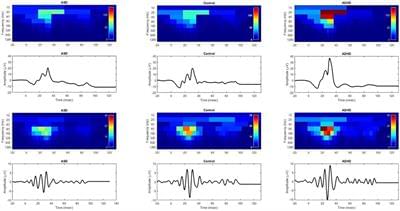
Methods: A total of 55 ASD, 15 ADHD and 156 control individuals took part in this study. Full field light-adapted electroretinograms (ERGs) were recorded using a Troland protocol, accounting for pupil size, with five flash strengths ranging from −0.12 to 1.20 log photopic cd.s.m–2. A DWT analysis was performed using the Haar wavelet on the waveforms to examine the energy within the time windows of the a-and b-waves and the oscillatory potentials (OPs) which yielded six DWT coefficients related to these parameters. The central frequency bands were from 20–160 Hz relating to the a-wave, b-wave and OPs represented by the coefficients: a20, a40, b20, b40, op80, and op160, respectively. In addition, the b-wave amplitude and percentage energy contribution of the OPs (%OPs) in the total ERG broadband energy was evaluated.
Results: There were significant group differences (p < 0.001) in the coefficients corresponding to energies in the b-wave (b20, b40) and OPs (op80 and op160) as well as the b-wave amplitude. Notable differences between the ADHD and control groups were found in the b20 and b40 coefficients. In contrast, the greatest differences between the ASD and control group were found in the op80 and op160 coefficients. The b-wave amplitude showed both ASD and ADHD significant group differences from the control participants, for flash strengths greater than 0.4 log photopic cd.s.m–2 (p < 0.001).