Taken from Consciousness Live! S3 Ep2: https://youtube.com/live/ljehy7-3TUQ?feature=share
Get the latest international news and world events from around the world.

Aqueous Metal-Ion Batteries: The Future of Safe and Sustainable Energy Storage
How can water-based batteries help improve lithium-ion energy storage and technology? This is what a series of studies published in Advanced Materials, Small Structures, Energy Storage Materials, and Energy & Environmental Science hopes to address as a team of international researchers led by Liaoning University in China have developed recyclable, aqueous-based batteries that won’t succumb to combustion or explosion. This study holds the potential to help researchers develop safer and more efficient water-based energy storage technologies for a cleaner future.
While lithium-ion batteries have proven reliable, they pose safety risks due to the organic electrolytes responsible for creating the electrical charge, which can lead to them catching fire or exploding, limiting their development for large-scale usage. To solve this problem, the researchers used water for driving the electric current between the battery’s terminals, nearly eliminating the chance for a safety hazard.
“Addressing end-of-life disposal challenges that consumers, industry and governments globally face with current energy storage technology, our batteries can be safely disassembled, and the materials can be reused or recycled,” said Dr. Tianyi Ma, who is a team member and a professor in the STEM | School of Science at RMIT University. “We use materials such as magnesium and zinc that are abundant in nature, inexpensive and less toxic than alternatives used in other kinds of batteries, which helps to lower manufacturing costs and reduces risks to human health and the environment.”
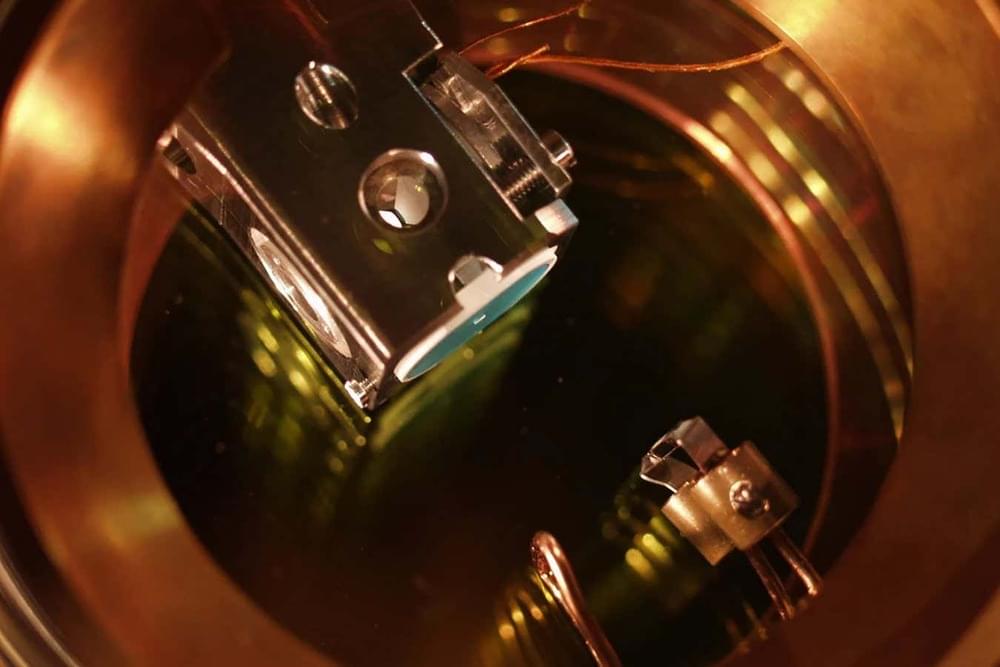
A single atom could drive a piston in a quantum engine
In a quantum engine, a single atom can emit radiation that bounces around a reflective cavity and creates enough pressure to push down a piston.

Materialism matters: The role of philosophy in science
In this first article in a series on philosophy and science, we take a look at materialism and why it is fundamental to science.
A short disclaimer before we read further: I’m a materialist. Materialism is a branch of philosophy to which the sciences, particularly the physical and life sciences, owe a lot. Materialism posits that the material world — matter — exists, and everything in the Universe, including consciousness, is made from or is a product of matter. An objective reality exists and we can understand it. Without materialism, physics, chemistry, and biology as we know it wouldn’t exist.
Another branch of philosophy, idealism, is in direct contradiction to materialism. Idealism states that, instead of matter, the mind and consciousness are fundamental to reality; that they are immaterial and therefore independent of the material world.
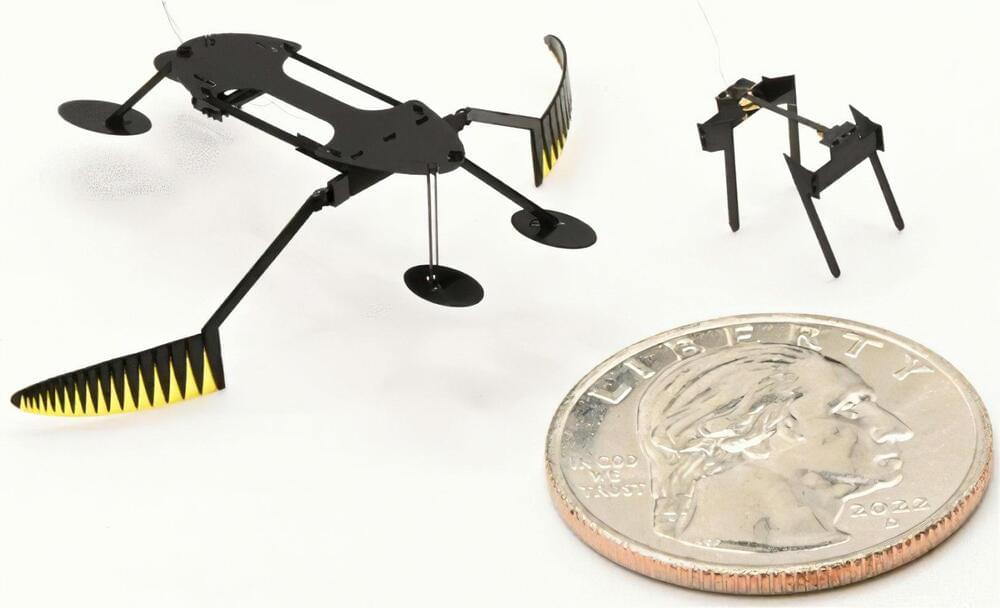
Scientists Have Created the World’s Smallest, Lightest, and Fastest Fully Functional Micro-Robots
Two insect-like robots, a mini-bug and a water strider, developed at Washington State University, are the smallest, lightest and fastest fully functional micro-robots ever known to be created.
Such miniature robots could someday be used for work in areas such as artificial pollination, search and rescue, environmental monitoring, micro-fabrication, or robotic-assisted surgery. Reporting on their work in the proceedings of the IEEE Robotics and Automation Society’s International Conference on Intelligent Robots and Systems, the mini-bug weighs in at eight milligrams while the water strider weighs 55 milligrams. Both can move at about six millimeters a second.
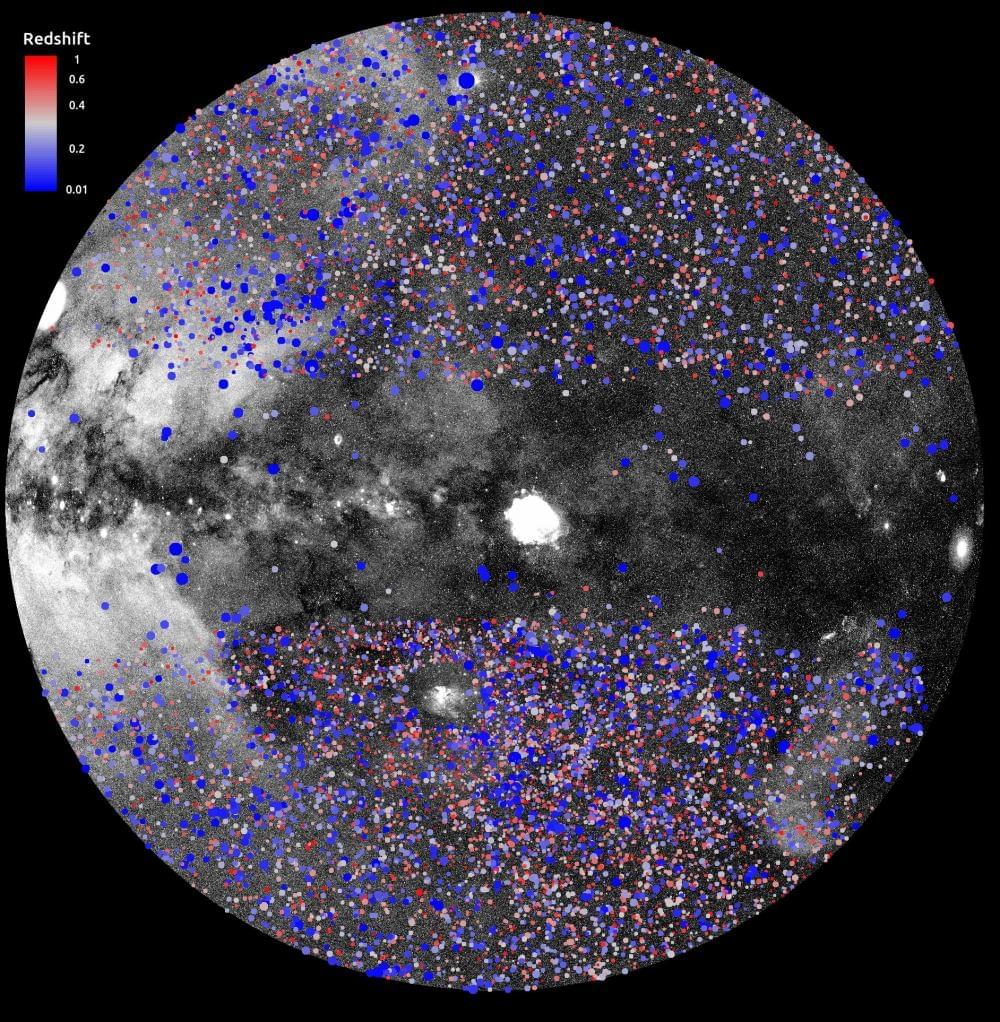
A New, More Accurate Measurement for the Clumpiness of the Universe
Cosmologists are wrestling with an interesting question: how much clumpiness does the Universe have? There are competing but not compatible measurements of cosmic clumpiness and that introduces a “tension” between the differing measurements. It involves the amount and distribution of matter in the Universe. However, dark energy and neutrinos are also in the mix. Now, results from a recent large X-ray survey of galaxy clusters may help “ease the tension”
The eROSITA X-ray instrument orbiting beyond Earth performed an extensive sky survey of galaxy clusters to measure matter distribution (clumpiness) in the Universe. Scientists at the Max Planck Institute for Extraterrestrial Physics recently shared their analysis of its cosmologically important data.
“eROSITA has now brought cluster evolution measurement as a tool for precision cosmology to the next level,” said Dr. Esra Bulbul (MPE), the lead scientist for eROSITA’s clusters and cosmology team. “The cosmological parameters that we measure from galaxy clusters are consistent with state-of-the-art cosmic microwave background, showing that the same cosmological model holds from soon after the Big Bang to today.”
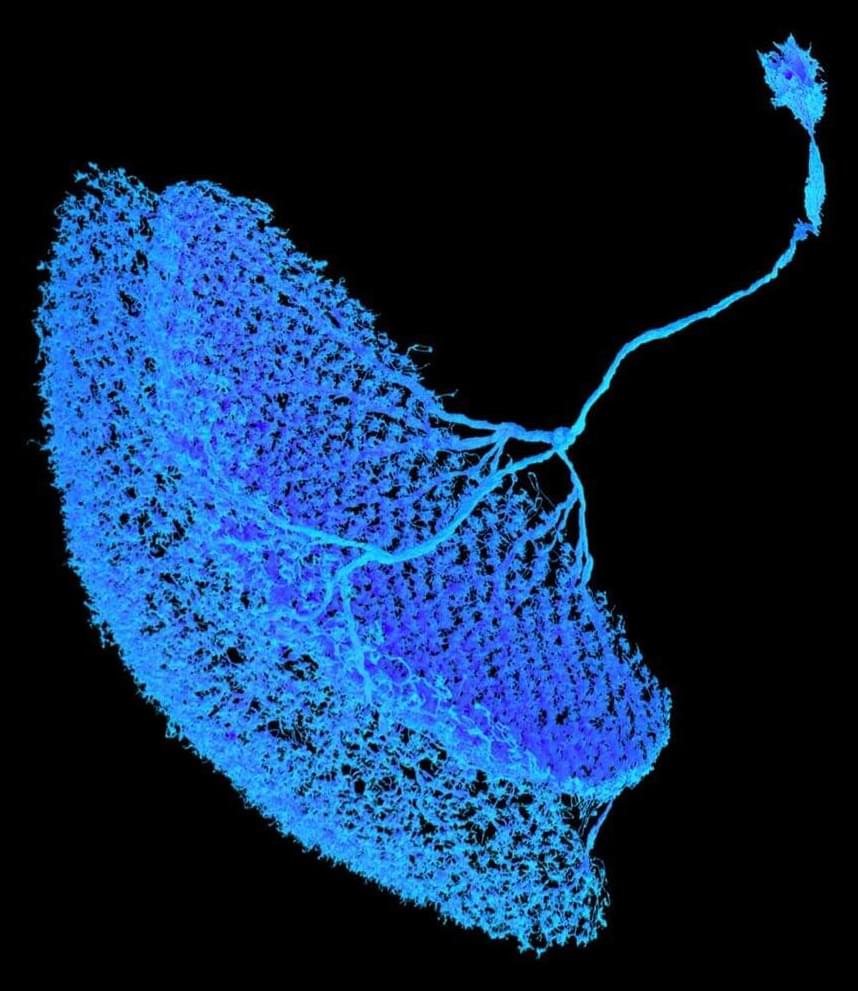
Fruit fly’s complex symphony of vision
An orchestra of complex neuronal networks performs a symphonic masterpiece called vision – an exciting field for neurobiologists like Alexander Borst, director at the Max Planck Institute for Biological Intelligence. In his department’s latest study, the scientists found a microcircuit which inverts excitatory to inhibitory signals and is thus able to transform a single type of neuronal input for multiple purposes. The discovery of this microcircuit is an important puzzle piece for the better understanding of the visual process of the fruit flies Drosophila and ultimately of vision itself.
Vision is one of the most important senses in humans. Accordingly, a large part of the brain is dedicated to processing visual information. In order to compute visual information quickly and accurately, a multitude of neuronal networks must perform a complex interplay — which fruit flies can help us to understand. Surprisingly, besides the obvious differences between the eyes of humans and fruit flies, many parallels can be found in the way how their brains process visual information. Since the visual system of flies is very efficient but significantly less complex than ours, it’s not surprising that this is one of the best understood neuronal network in neuroscience.
In the flies’ visual system, a cascade of cells is responsible to transform light information into direction-specific signals. T4 cells, for example, respond to moving bright edges (ON-pathway), while T5 cells only respond to moving dark edges (OFF-pathway). Both, T4 and T5 cells, have four subtypes that are tuned to the four cardinal directions (front-to-back, back-to-front, upwards and downwards). This means that each neuron only reacts to a specific direction of visual motion, their so-called preferred direction, while showing little reaction when stimulated by a moving edge in other directions (= null direction).
Microscopic Origin of the Entropy of Black Holes in General Relativity
In the 1970s, physicists Bekenstein and Hawking used general relativity and quantum mechanics in curved spacetime to propose that black holes behave as thermodynamic objects. They found that black holes carry an entropy described by a remarkable formula that applies for any mass, charge, angular momentum, or spacetime dimension. Here, we use new results at the interface of quantum information theory and quantum gravity to address an outstanding challenge: how to explain the microscopic origin of this formula.
In quantum mechanics, entropy measures the logarithm of the dimension of the space of microstates consistent with the macroscopic description of a system. We show that, in any theory of gravity that reduces to general relativity with matter at low energies, there are infinite families of states that have geometries identical to the black hole outside the horizon but different structures inside. We show that these states overlap quantum mechanically because of gravitational wormholes. The overlaps have a dramatic consequence: The microstates span a space whose dimension equals the exponential of the Bekenstein-Hawking entropy formula.
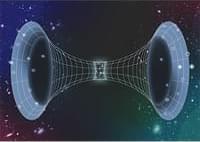
This explanation of black-hole entropy does not require new forms of matter and involves a novel description of all black-hole microstates as quantum superpositions of objects having geometric semiclassical descriptions. Our results also imply a macroscopic manifestation of quantum mechanics in cosmic settings: We show that one can understand long Einstein-Rosen bridges between universes as quantum superpositions of short bridges.