Researchers from the University of Southern Denmark and Odense University Hospital have studied tissue from patients with atherosclerosis. They found that many of the cells in the diseased tissue carried the same genetic alteration and appeared to originate from a single ancestral cell that had divided repeatedly—a pattern otherwise associated with tumor biology.
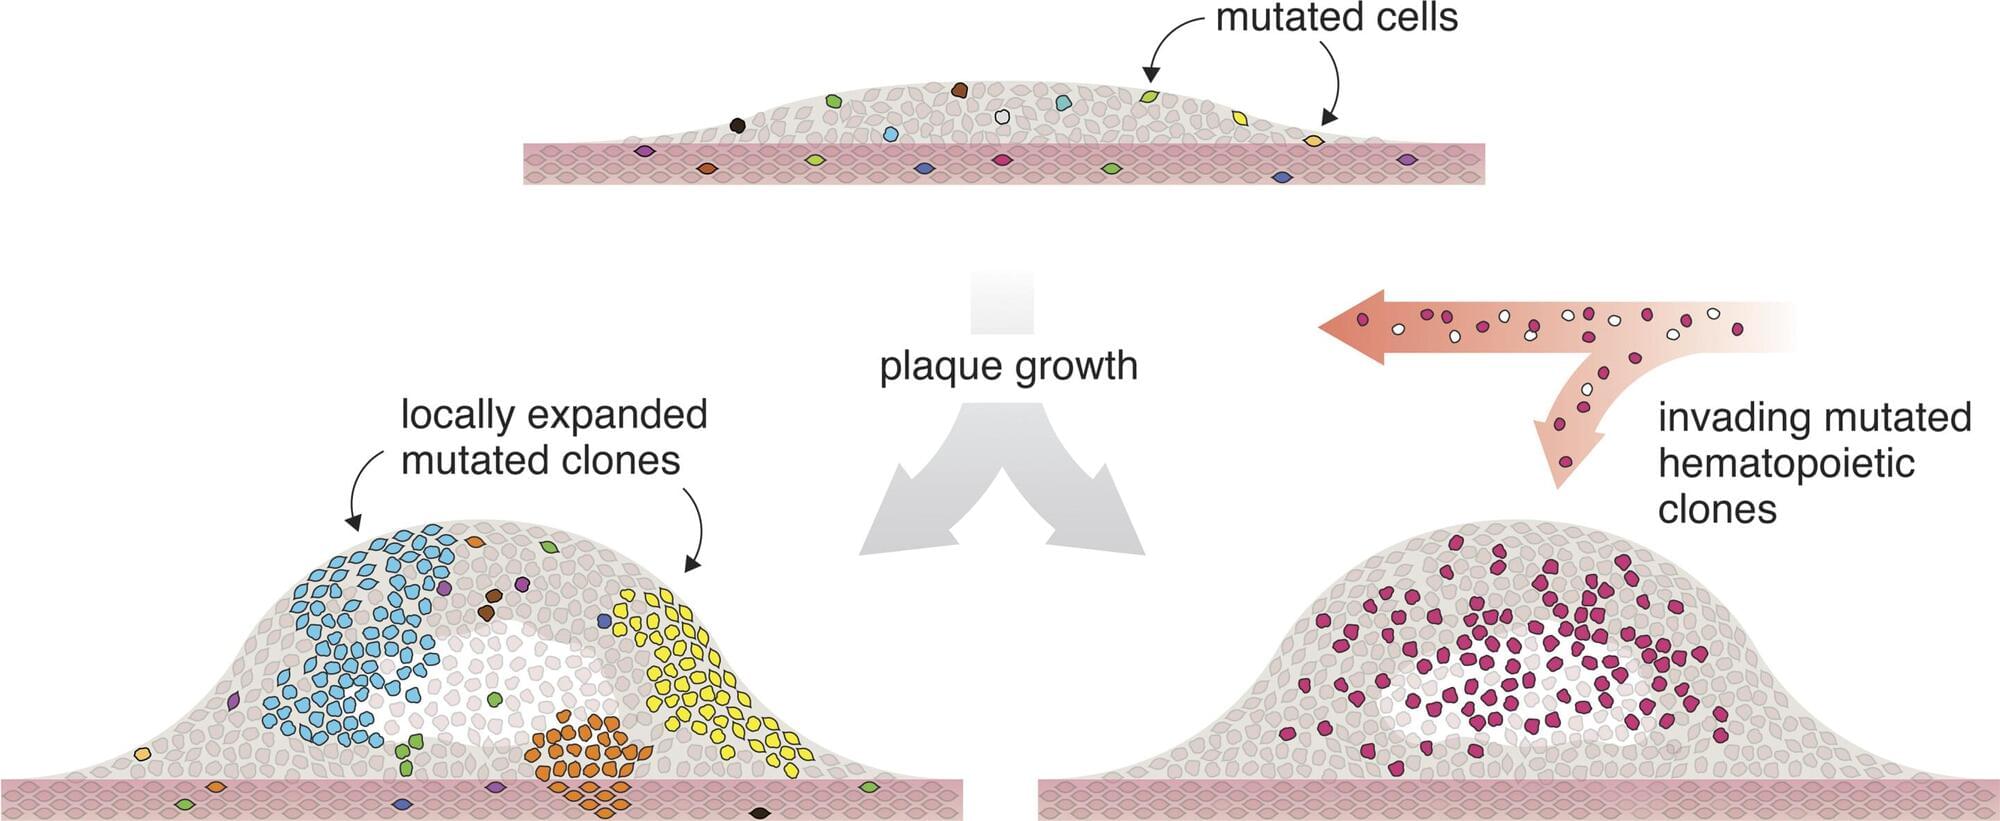
In several patients, a large proportion of the cells were derived from one single mutated cell that had undergone many rounds of cell division.
“It’s striking how many cells in the tissue share the exact same genetic change. In several samples, more than 10% of the cells—hundreds of thousands cells—carried the same alteration. It’s difficult to interpret this as anything other than all these cells originating from a shared ancestral cell that, at some point during disease development, acquired the mutation,” says Lasse Bach Steffensen, Associate Professor at the Department of Molecular Medicine at the University of Southern Denmark.