Who needs sci-fi references when you have a colonoscopy video?
Get the latest international news and world events from around the world.


Grok Imagine, xAI’s new AI image and video generator, lets you make NSFW content
Elon Musk’s AI company has officially rolled out Grok Imagine, xAI’s image and video generator, to all SuperGrok and Premium+ X subscribers on its iOS app. And true to form for Musk, who positions Grok as an unfiltered, boundary-pushing AI, the generator allows users to make NSFW content.
Grok Imagine, which promises to turn text or image prompts into a 15-second video featuring native audio, has a “spicy mode” that allows users to generate sexually explicit content, including partial female nudity. There are limits to how explicit one can get. Many of our spicier prompts — made in the name of Journalism! — generate blurred-out images that are “moderated” and therefore inaccessible. We were, however, able to generate semi-nude imagery.
The NSFW content is unsurprising for xAI, given the release last month of a raunchy, hyper-sexualized anime AI companion. But just as Grok’s unrestrained nature was entertaining until it started spewing hateful, antisemitic, misogynistic content, Grok Imagine could be poised to bring its own set of unintended consequences.


Brain cells controlling stress switch on and off in hourly cycles
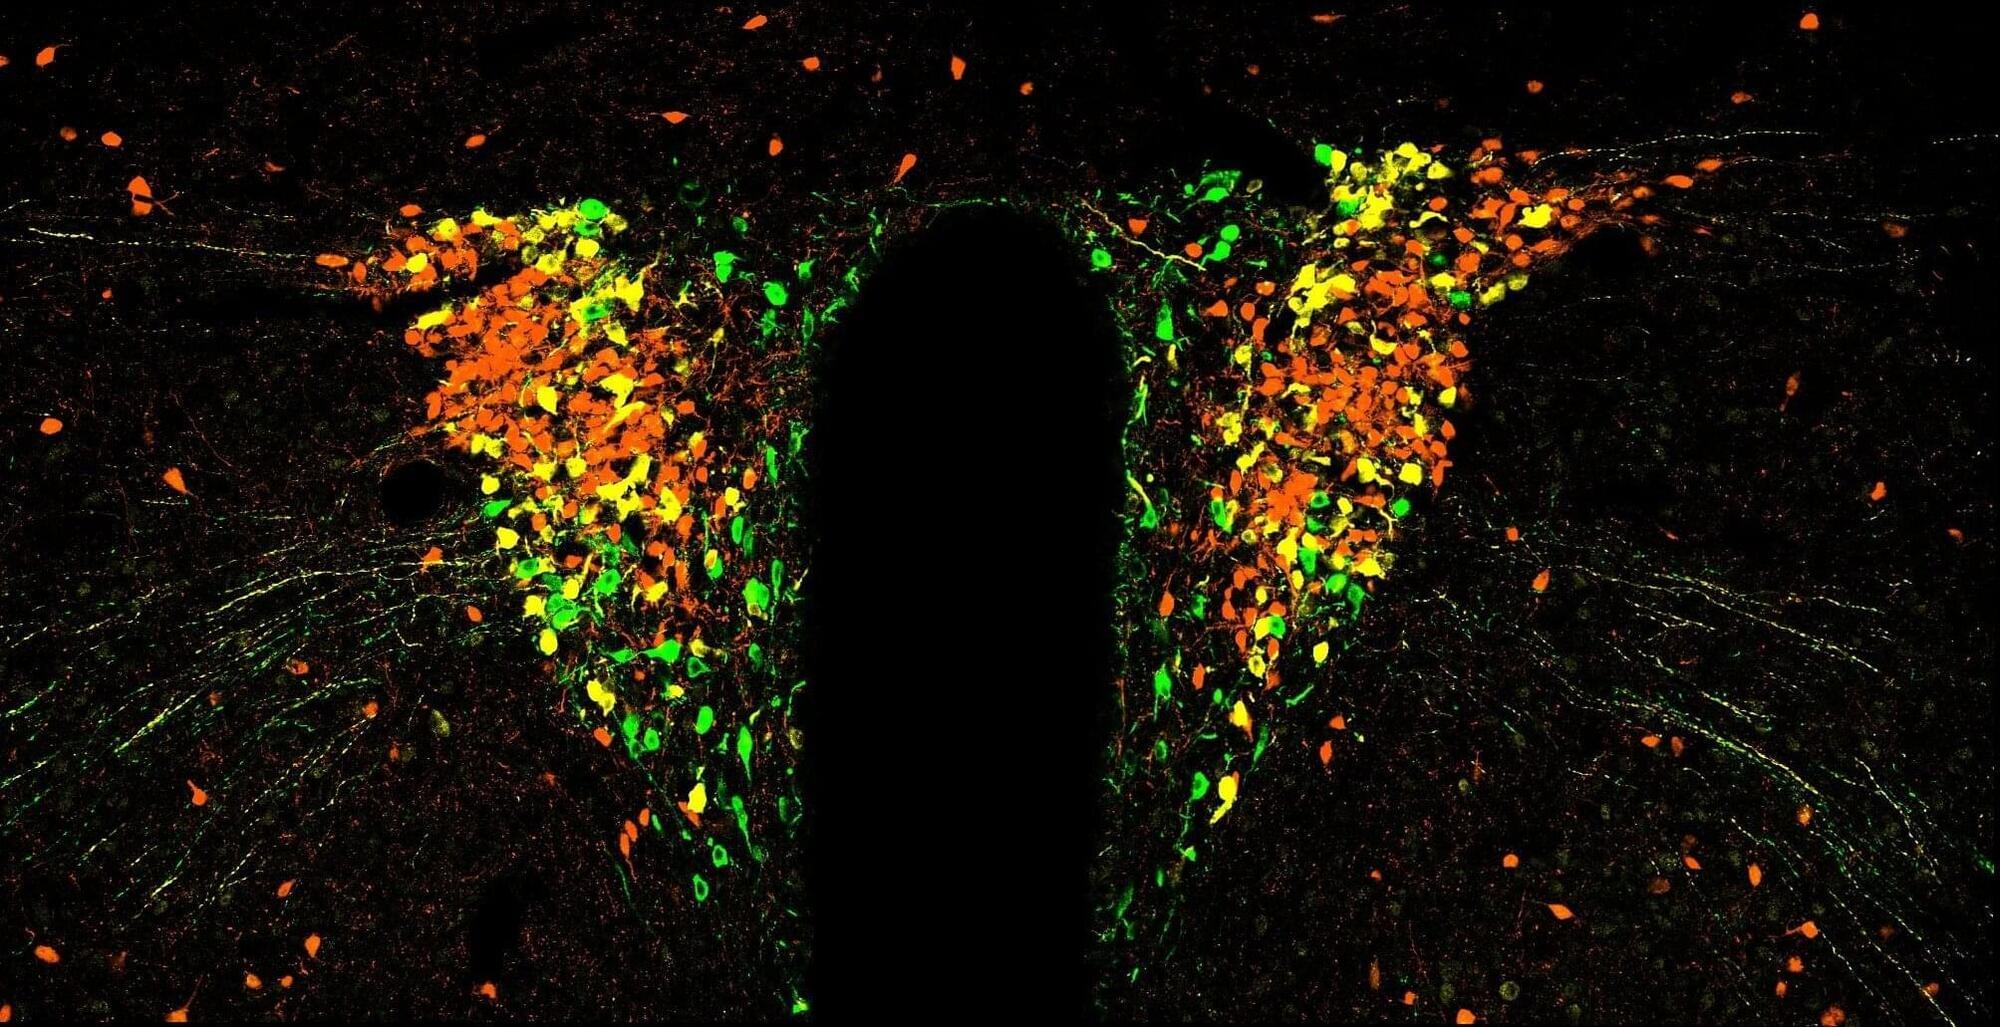
University of Otago Ōtākou Whakaihu Waka-led research has found stress-controlling brain cells switch on and off in a steady rhythm about once every hour—even when nothing stressful is happening.
Senior author Associate Professor Karl Iremonger, of Otago’s Department of Physiology and Center for Neuroendocrinology, says these rhythms shape activity patterns and alertness.
These bursts of brain cell activity seem to act like a natural ‘wake-up’ signal, and often lead to a rise in stress hormones, or cortisol.

Vagus nerve stimulation paired with meditation increases self-compassion and mindfulness benefits
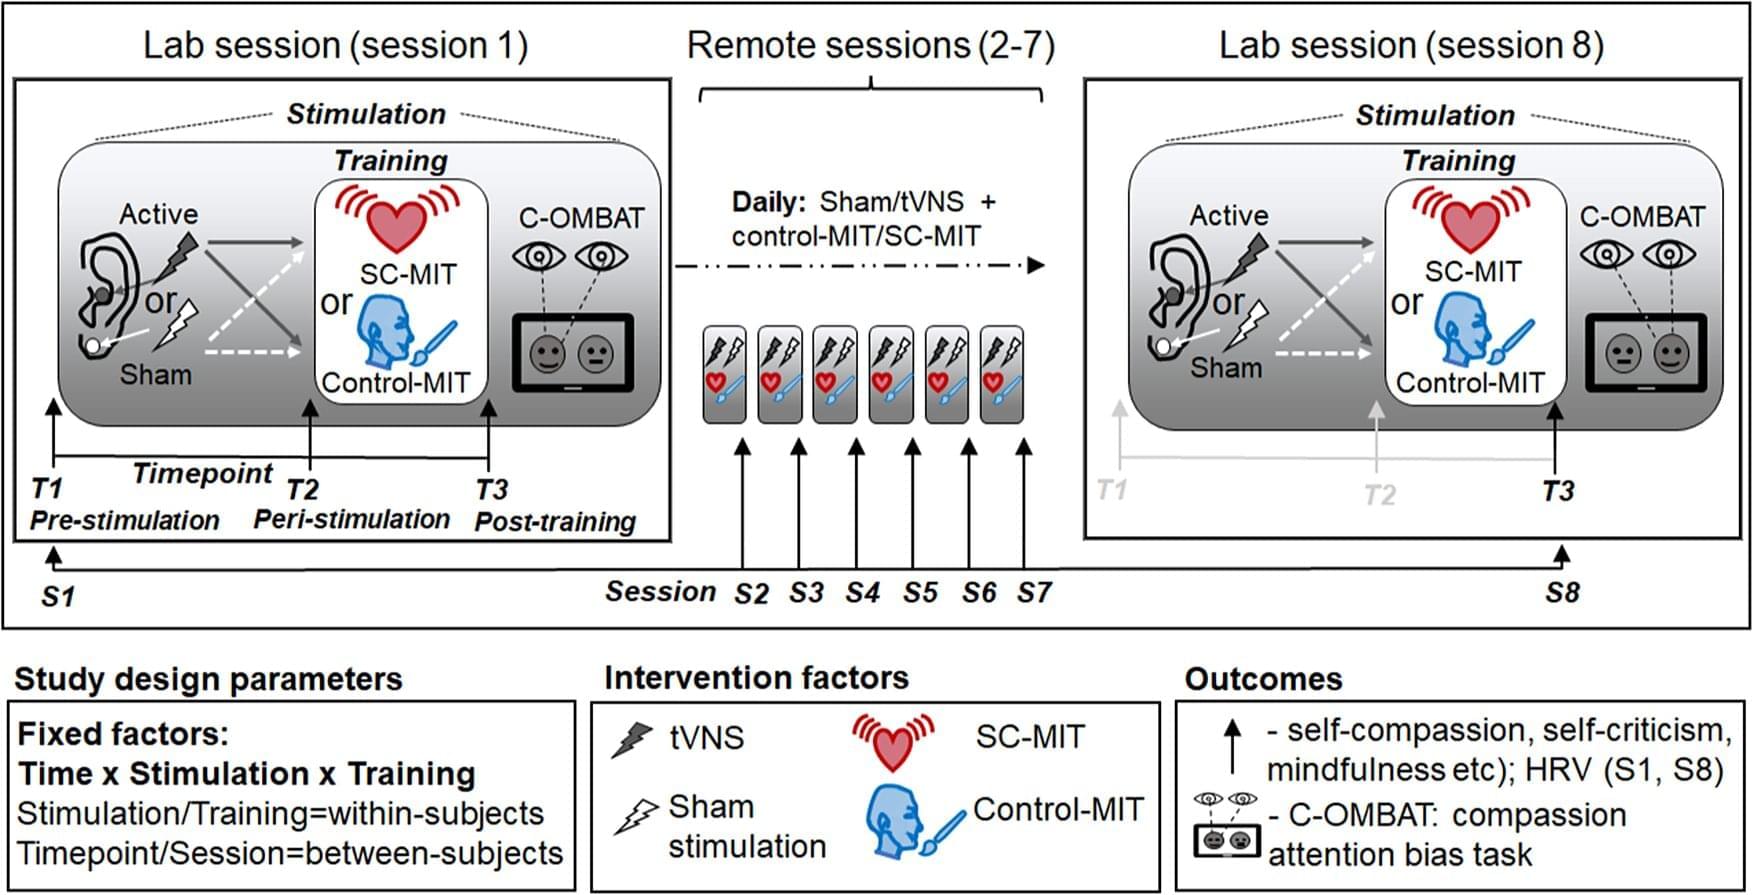
Stimulating the vagus nerve with a device attached to the outer ear can help make compassion meditation training more effective at boosting people’s capacity for self-kindness and mindfulness, finds a new study led by University College London (UCL) researchers.
The study, published in Psychological Medicine, adds to evidence of the potential benefits of stimulating this key nerve that connects the brain with major organs in the chest and abdomen.
The vagus nerve plays a crucial role in the “rest-and-digest” (parasympathetic) system, counteracting the “fight-or-flight” (sympathetic) stress response, and allows the brain to communicate with all major organs in the body. By transmitting signals from the body up to the brain, the vagus nerve can also regulate a range of psychological processes, including some involved in social interactions and emotional control.