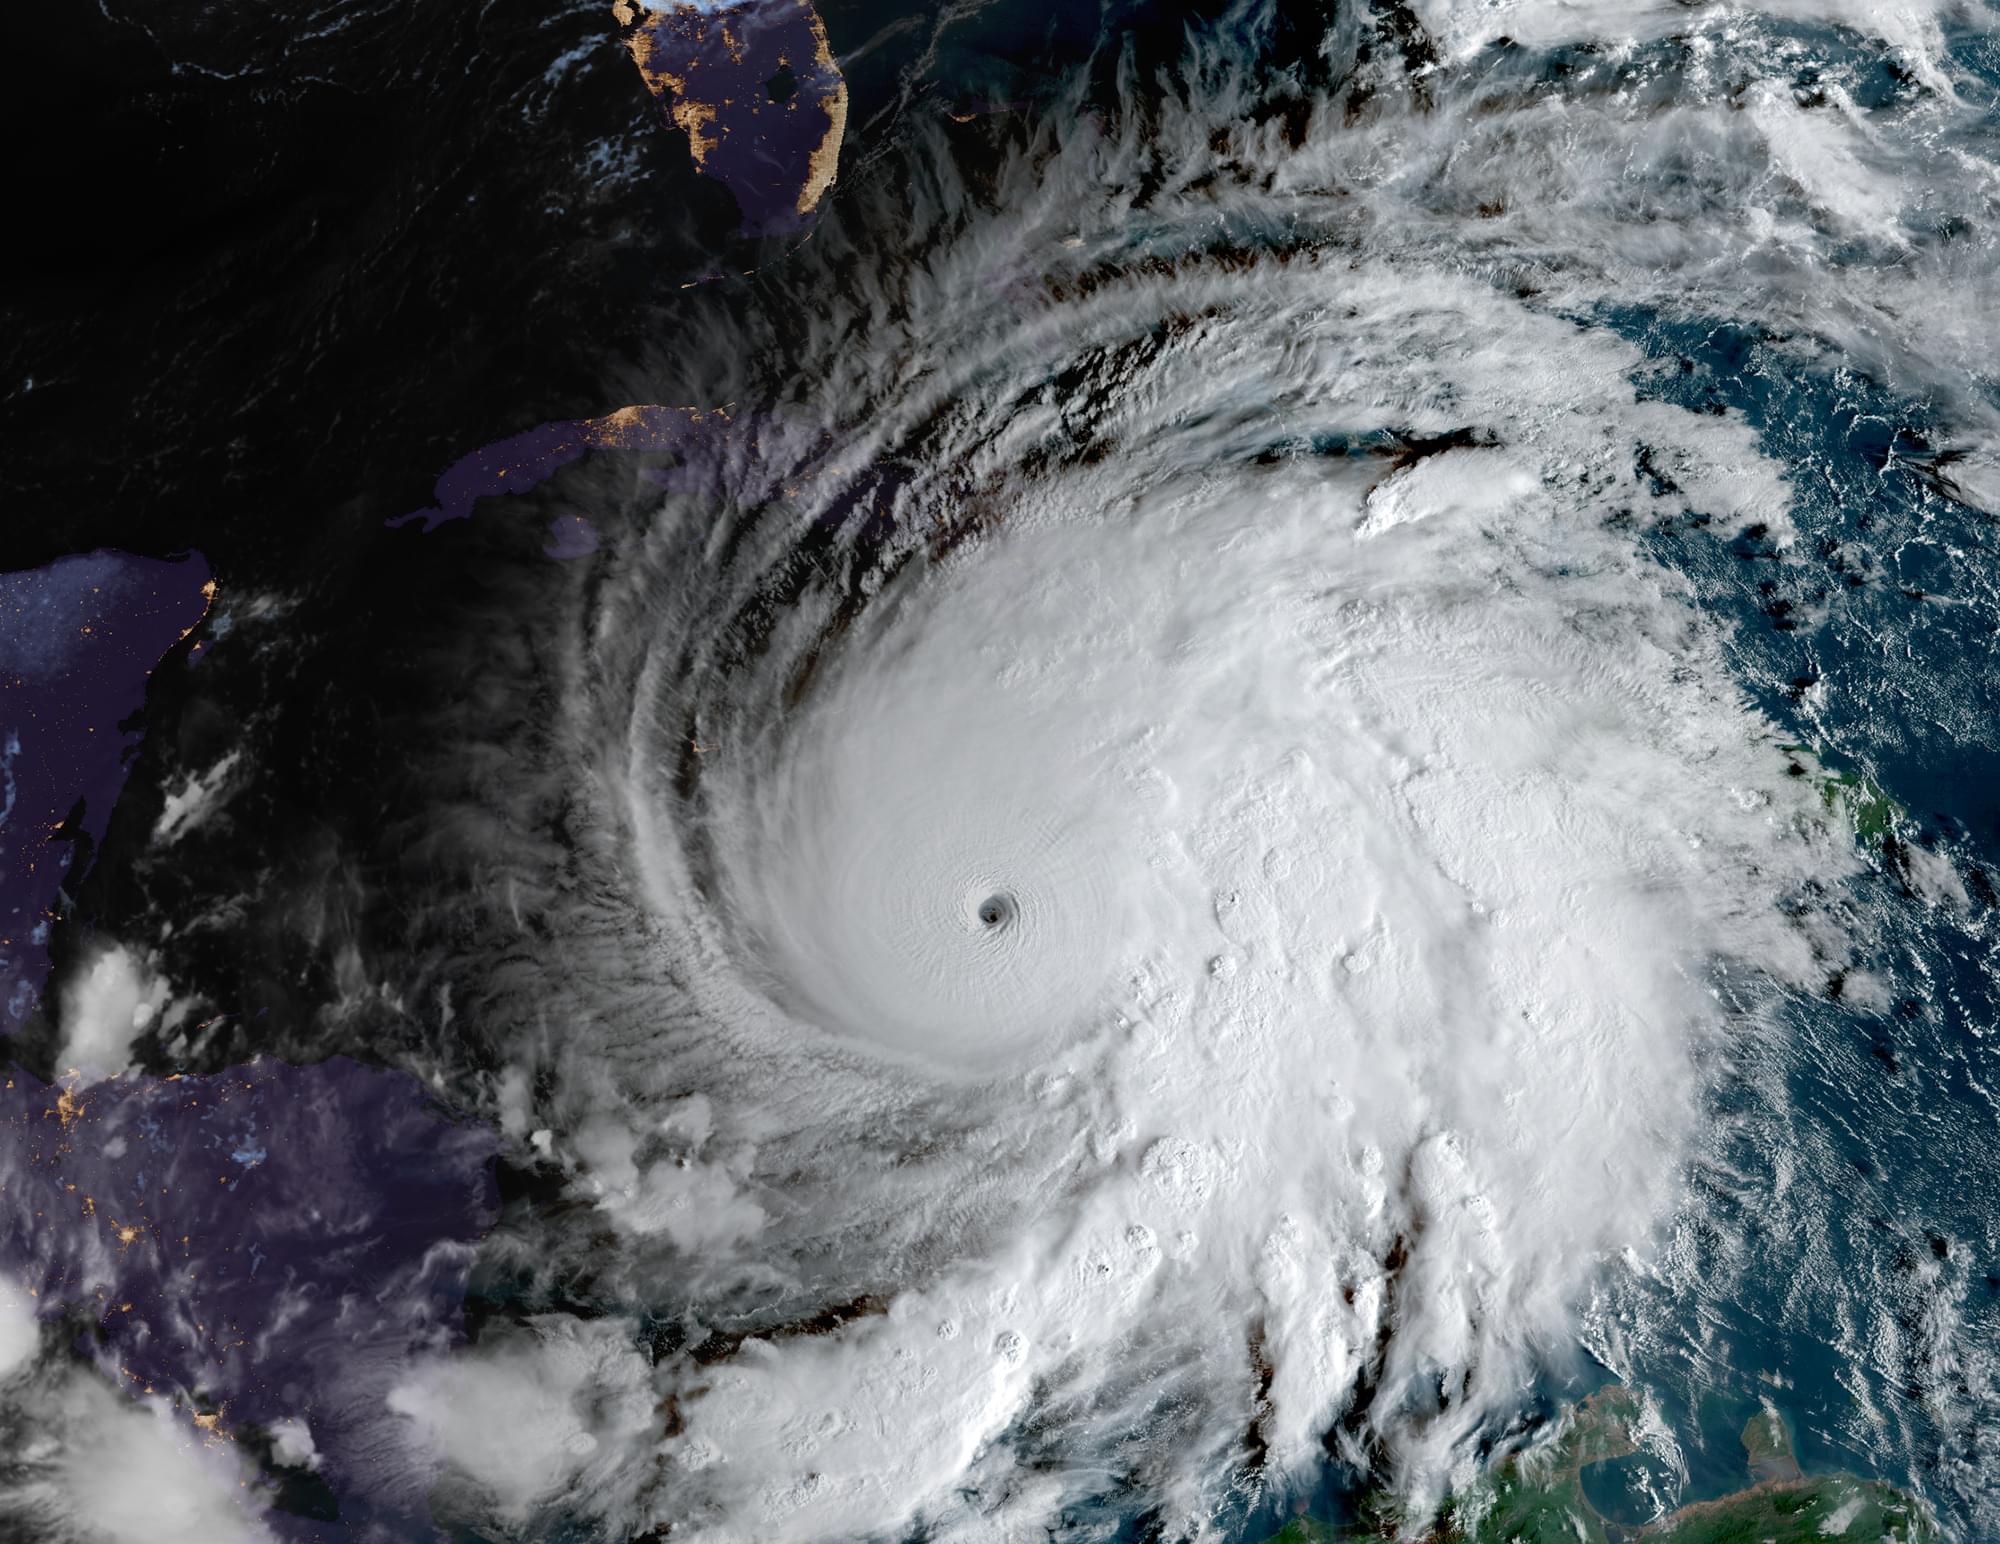
Toggle light / dark theme

Community estimate of global glacier mass changes from 2000 to 2023

Glaciers separate from the continental ice sheets in Greenland and Antarctica covered a global area of approximately 706,000 km2 around the year 200019, with an estimated total volume of 158,170 ± 41,030 km3, equivalent to a potential sea-level rise of 324 ± 84 mm (ref. 20). Glaciers are integral components of Earth’s climate and hydrologic system1. Hence, glacier monitoring is essential for understanding and assessing ongoing changes21,22, providing a basis for impact2,3,4,5,6,7,8,9,10 and modelling11,12,13 studies, and helping to track progress on limiting climate change23. The four main observation methods to derive glacier mass changes include glaciological measurements, digital elevation model (DEM) differencing, altimetry and gravimetry. Additional concepts include hybrid approaches that combine different observation methods. In situ glaciological measurements have been carried out at about 500 unevenly distributed glaciers24, representing less than 1% of Earth’s glaciers19. Glaciological time series provide seasonal-to-annual variability of glacier mass changes25. Although these are generally well correlated regionally, long-term trends of individual glaciers might not always be representative of a given region. Spaceborne observations complement in situ measurements, allowing for glacier monitoring at global scale over recent decades. Several optical and radar sensors allow the derivation of DEMs, which reflect the glacier surface topography. Repeat mapping and calculation of DEM differences provide multi-annual trends in elevation and volume changes26 for all glaciers in the world27. Similarly, laser and radar altimetry determine elevation changes along linear tracks, which can be extrapolated to calculate regional estimates of glacier elevation and volume change28. Unlike DEM differencing, altimetry provides spatially sparse observations but has a high (that is, monthly to annual) temporal resolution26. DEM differencing and altimetry require converting glacier volume to mass changes using density assumptions29. Satellite gravimetry estimates regional glacier mass changes at monthly resolution by measuring changes in Earth’s gravitational field after correcting for solid Earth and hydrological effects30,31. Although satellite gravimetry provides high temporal resolution and direct estimates of mass, it has a spatial resolution of a few hundred kilometres, which is several orders of magnitude lower than DEM differencing or altimetry26.

The heterogeneity of these observation methods in terms of spatial, temporal and observational characteristics, the diversity of approaches within a given method, and the lack of homogenization challenged past assessments of glacier mass changes. In the Intergovernmental Panel on Climate Change (IPCC)’s Sixth Assessment Report (AR6)16, for example, glacier mass changes for the period from 2000 to 2019 relied on DEM differencing from a limited number of global27 and regional studies16. Results from a combination of glaciological and DEM differencing25 as well as from gravimetry30 were used for comparison only. The report calculated regional estimates over a specific baseline period (2000–2019) and as mean mass-change rates based on selected studies per region, which only partly considered the strengths and limitations of the different observation methods.

The spread of reported results—many outside uncertainty margins—and recent updates from different observation methods afford an opportunity to assess regional and global glacier mass loss with a community-led effort. Within the Glacier Mass Balance Intercomparison Exercise (GlaMBIE; https://glambie.org), we collected, homogenized and combined regional results from the observation methods described above to yield a global assessment towards the upcoming IPCC reports of the seventh assessment cycle. At the same time, GlaMBIE provides insights into regional trends and interannual variabilities, quantifies the differences among observation methods, tracks observations within the range of projections, and delivers a refined observational baseline for future impact and modelling studies.

This Strange Motion Keeps Appearing Everywhere — Even in High-Energy Collisions

Particles in high-energy nuclear collisions move in a way that follows a pattern known as Lévy walks, a motion found across many scientific fields.

Named after mathematician Paul Lévy, Lévy walks (or, in some cases, Lévy flights) describe a type of random movement seen in nature and various scientific processes. This pattern appears in diverse phenomena, from how predators search for food to economic fluctuations, microbiology, chemical reactions, and even climate dynamics.

Lévy walks in high-energy nuclear collisions.

How topology drives complexity in brain, climate and AI

A study led by Professor Ginestra Bianconi from Queen Mary University of London, in collaboration with international researchers, has unveiled a transformative framework for understanding complex systems.

Published in Nature Physics, this paper establishes the new field of higher-order topological dynamics, revealing how the hidden geometry of networks shapes everything from brain activity to .

“Complex systems like the brain, climate, and next-generation artificial intelligence rely on interactions that extend beyond simple pairwise relationships. Our study reveals the critical role of higher-order networks, structures that capture multi-body interactions, in shaping the dynamics of such systems,” said Professor Bianconi.

From Metal Rain to Roaring Jet Streams: The First 3D Look at an Alien Atmosphere

Astronomers have mapped the 3D structure of an exoplanet’s atmosphere for the first time, revealing powerful winds that transport elements like iron and titanium. Using all four telescope units of the European Southern Observatory’s Very Large Telescope (ESO’s VLT), researchers uncovered complex weather patterns shaping the planet’s skies. This breakthrough paves the way for more detailed studies of atmospheric composition and climate on distant worlds.

Validation technique could help scientists make more accurate forecasts

MIT researchers developed a new approach for assessing predictions with a spatial dimension, like forecasting weather or mapping air pollution.

Re relying on a weather app to predict next week’s temperature. How do you know you can trust its forecast? Scientists use statistical and physical models to make predictions about everything from weather to air pollution. But checking whether these models are truly reliable is trickier than it seems—especially when the locations where we have validation data don Traditional validation methods struggle with this problem, failing to provide consistent accuracy in real-world scenarios. In this work, researchers introduce a new validation approach designed to improve trust in spatial predictions. They define a key requirement: as more validation data becomes available, the accuracy of the validation method should improve indefinitely. They show that existing methods don’t always meet this standard. Instead, they propose an approach inspired by previous work on handling differences in data distributions (known as “covariate shift”) but adapted for spatial prediction. Their method not only meets their strict validation requirement but also outperforms existing techniques in both simulations and real-world data.

By refining how we validate predictive models, this work helps ensure that critical forecasts—like air pollution levels or extreme weather events—can be trusted with greater confidence.


A new evaluation method assesses the accuracy of spatial prediction techniques, outperforming traditional methods. This could help scientists make better predictions in areas like weather forecasting, climate research, public health, and ecological management.

New study reveals what brings rainfall to ice shelves in West Antarctica

Extreme precipitation events in Antarctica, which are mostly dominated by snowfall due to sub-zero temperatures, also include rainfall, according to new research.

BAS scientists studying atmospheric rivers—narrow bands of concentrated moisture in the atmosphere or “rivers in the sky”—have discovered that these phenomena bring not only snow but also rain to parts of Antarctica, even during the continent’s cold winter months. The results are published in the journal The Cryosphere.

Using cutting-edge regional climate models (RCMs) at a of just one kilometer, the researchers explored how atmospheric rivers interact with Antarctica’s rugged terrain to deliver significant precipitation to key areas, including the Thwaites and Pine Island Ice Shelves in West Antarctica. These are areas known for their ongoing retreat and contribution to global sea-level rise.

New Bio-Sourced Plastic Could Revolutionize Recycling of Thermosets

What types of new plastics can be developed with enhanced recycling capabilities? This is what a recent study published in Nature hopes to address as a team of researchers at Cornell University have developed an enhanced type of thermoset, which is built from a type of polymer that is often difficult to recycle, resulting in it being put back into the atmosphere from burning it or into landfills, which destroy marine ecosystems. This study has the potential to help scientists, engineers, policymakers, and the public better understand new recycling methods that can be used to both help the environment and mitigate the impacts of climate change.

For the study, the researchers used a bio-sourced material known as dihydrofuran (DHF) to design and build a new thermoset polymer that maintains its robustness while ensuring safely being recycled through heat and environmental degradation. When compared to traditional thermosets, the DHF thermosets can still be used for a myriad of commercial applications, including footwear, electronics, and garden hoses, just to name a few.

“We’ve spent 100 years trying to make polymers that last forever, and we’ve realized that’s not actually a good thing,” said Dr. Brett Fors, who is a professor of physical chemistry at Cornell University and a co-author on the study. “Now we’re making polymers that don’t last forever, that can environmentally degrade.”

Asteroid impact simulation reveals climate and ecological disruptions

A new climate modeling study published in the journal Science Advances by researchers from the IBS Center for Climate Physics (ICCP) at Pusan National University in South Korea presents a new scenario of how climate and life on our planet would change in response to a potential future strike of a medium-sized (~500 m) asteroid.

The solar system is full of objects with near-Earth orbits. Most of them do not pose any threat to Earth, but some of them have been identified as objects of interest with non-negligible collision probabilities. Among them is the asteroid Bennu with a diameter of about 500 m, which—according to recent studies—has an estimated chance of 1 in 2700 of colliding with Earth in September 2182. This is similar to the probability of flipping a coin 11 times in a row with the same outcome.

To determine the potential impacts of an asteroid strike on our climate system and on and plankton in the ocean, researchers from the ICCP set out to simulate an idealized collision scenario with a medium-sized asteroid using a state-of-the-art climate model.

Climate puzzle persists with unexpectedly warm January

Last month was the world’s warmest January on record and raised further questions about the pace of climate change, scientists say.

January 2025 had been expected to be slightly cooler than January 2024 because of a shift away from a natural weather pattern in the Pacific known as El Niño.

But instead, last month broke the January 2024 record by nearly 0.1C, according to the European Copernicus climate service.